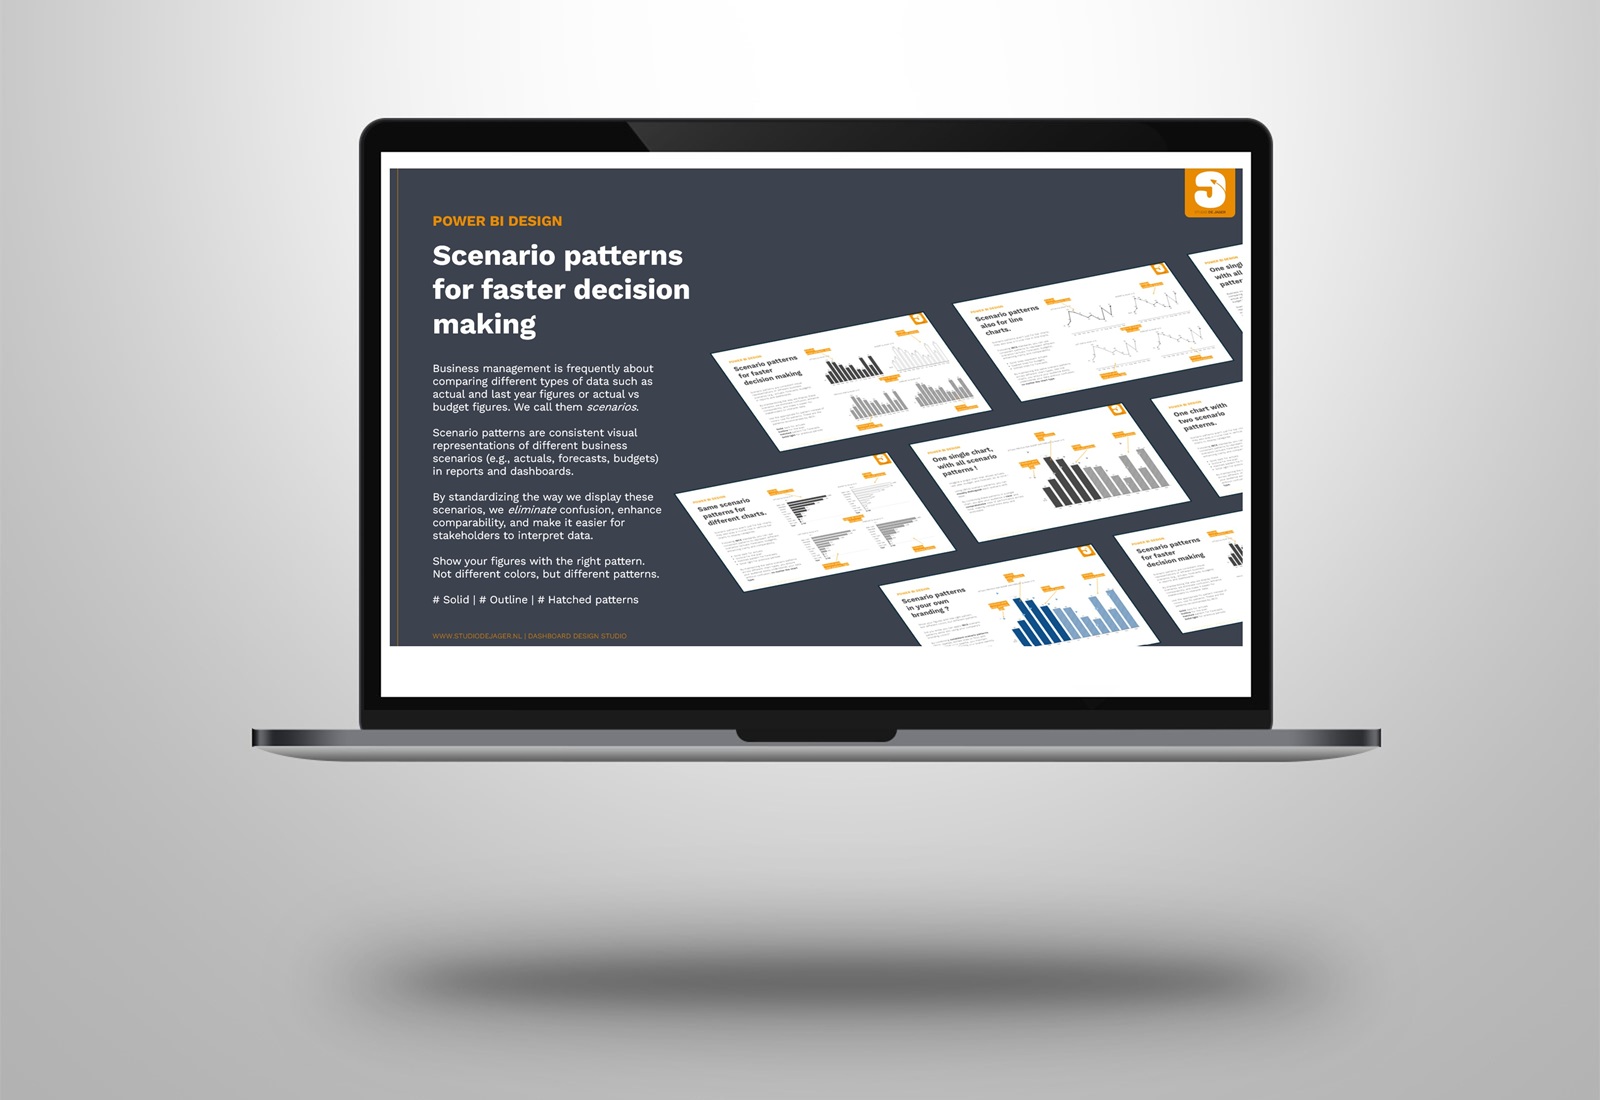
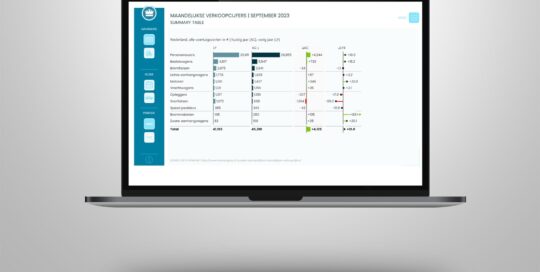
𝐀𝐫𝐞 𝐲𝐨𝐮 𝐮𝐬𝐢𝐧𝐠 𝐬𝐜𝐞𝐧𝐚𝐫𝐢𝐨 𝐩𝐚𝐭𝐭𝐞𝐫𝐧𝐬 𝐢𝐧 𝐲𝐨𝐮𝐫 𝐫𝐞𝐩𝐨𝐫𝐭𝐬 ? If not, you might be missing out on a powerful tool to enhance data clarity and communication. In today's data-driven world, 𝐜𝐥𝐞𝐚𝐫 𝐚𝐧𝐝 𝐞𝐟𝐟𝐞𝐜𝐭𝐢𝐯𝐞 communication of business metrics is critical. One powerful tool to achieve this is the 𝐮𝐬𝐞 𝐨𝐟 𝐬𝐜𝐞𝐧𝐚𝐫𝐢𝐨 𝐩𝐚𝐭𝐭𝐞𝐫𝐧𝐬, a key component >> Lees verder
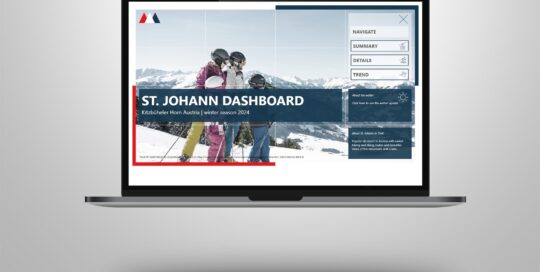
Power BI | St Johann ski dashboard
Sasja Jager, de2025-11-14T13:45:31+01:00I am happy to share with you an exciting new project I've been working on - the St Johann in Tirol Power BI dashboard! Inspired by the recent visit with my family to the St Johann in Tirol ski area in Austria, I've created this website-inspired dashboard that captures the essence of the >> Lees verder

Power BI | Schmitten dashboard
Sasja Jager, de2025-11-14T13:41:41+01:00𝐒𝐂𝐇𝐌𝐈𝐓𝐓𝐄𝐍 𝐃𝐀𝐒𝐇𝐁𝐎𝐀𝐑𝐃 - 𝐔𝐋𝐓𝐈𝐌𝐀𝐓𝐄 𝐒𝐊𝐈 𝐄𝐗𝐏𝐄𝐑𝐈𝐄𝐍𝐂𝐄 𝐃𝐄𝐒𝐈𝐆𝐍 I am thrilled to share with you an exciting new project I've been working on - the Schmitten Power BI dashboard! Inspired by the recent visit with my family to the Schmitten ski area in Austria, I've created this website-inspired dashboard that captures the essence of >> Lees verder
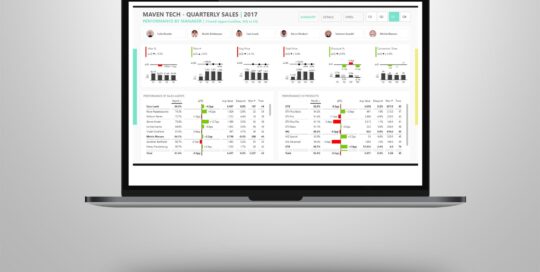
Power BI | Maven Analytics – Sales Challenge
Sasja Jager, de2025-11-14T13:35:51+01:00I had some time this weekend to participate in the Maven Analytics sales challenge. The goal was to create an interactive Power BI dashboard that enables sales managers to track their team's quarterly performance. Used parts in the dashboard: 1. Zebra BI chart and table visuals 2. New Card visuals 3. New Slicer 4. For the >> Lees verder
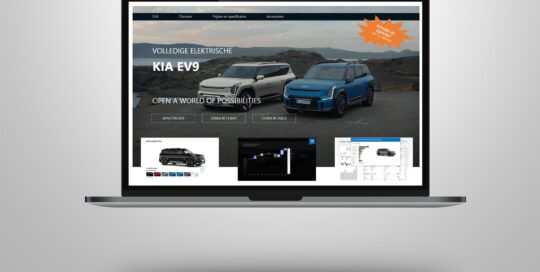
Power BI | KIA EV9
Sasja Jager, de2025-11-14T13:21:09+01:00What do you think of the new car from 𝐊𝐈𝐀, 𝐭𝐡𝐞 𝐦𝐨𝐝𝐞𝐥 𝐄𝐕9? Take a look in my 𝐏𝐨𝐰𝐞𝐫 𝐁𝐈 report in which I created a nice UI design, as if it is a website. Last month Microsoft released the 𝐧𝐞𝐰 𝐬𝐥𝐢𝐜𝐞𝐫𝐬 + 𝐜𝐚𝐫𝐝𝐬 and of course I had to test them. Because >> Lees verder
Power BI | RAI data – dashboard makeover
Sasja Jager, de2025-11-14T12:21:33+01:00I'm passionate about my work as a front-end Power BI consultant. I love to combine 𝘥𝘦𝘴𝘪𝘨𝘯 with 𝘢𝘤𝘵𝘪𝘰𝘯-𝘰𝘳𝘪𝘦𝘯𝘵𝘦𝘥 visuals from Zebra BI in Power BI and I'm a big fan of the IBCS – International Business Communication Standards. Recently I came across an online dashboard from the RAI Vereniging and I thought ...... there >> Lees verder
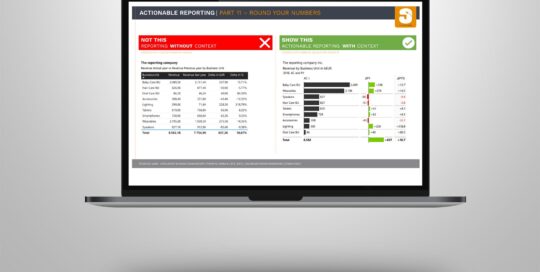
Power BI | Actionable reporting – part 11 – round your numbers & move units to the title
Sasja Jager, de2025-11-14T13:13:02+01:00Too much detail in your visuals can distract from what's really important. You don't want your dashboard to be filled with large numbers, decimal places or showing measure units in your tables. So don't include more detailed precision than is necessary. In today's reality, creating reports that are just showing some numbers is >> Lees verder
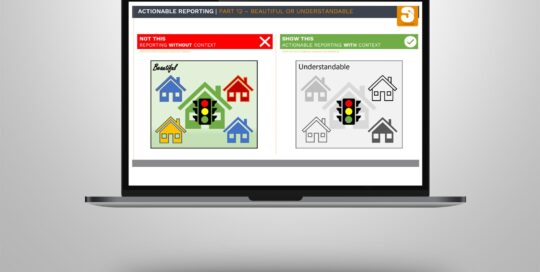
Power BI | Actionable reporting – part 12 – beautiful or understandable
Sasja Jager, de2025-11-14T13:12:39+01:00What should be the primary aim of a report’s visual design? It should not be beauty, but simple comprehension. Many will find the richly colored picture on the left of the attached example more beautiful than the one on the right. But what if our message concerns the traffic light? It is much >> Lees verder
Power BI | Actionable reporting – part 10 – achieve consistency in reporting
Sasja Jager, de2025-11-14T13:12:23+01:00Introducing the power duo: IBCS and Zebra BI. By adopting these industry standards and cutting-edge tools, your company can achieve consistency and clarity in its reports. IBCS (International Business Communication Standards) provides a framework for standardized reporting, ensuring that your reports are clear, concise, and easily understandable across departments and stakeholders. Complementing IBCS, >> Lees verder
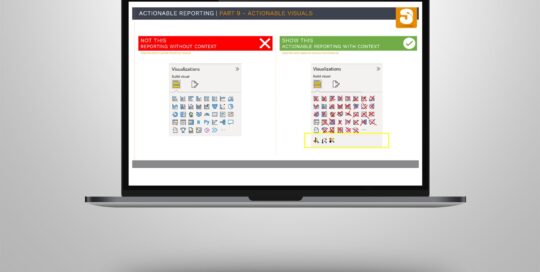
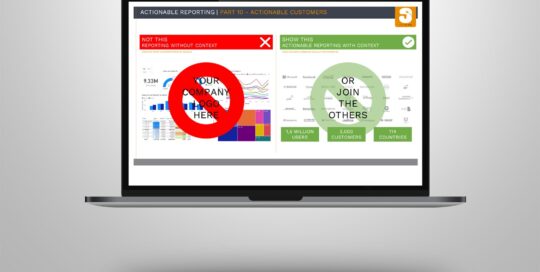
Power BI | Actionable reporting – part 9 – actionable visuals
Sasja Jager, de2025-11-14T13:12:02+01:00Last year I started making a number of posts to share some tips and tricks about making actionable reports. Given the positive feedback I've received, I've decided to continue this series with actionable visuals. In Power BI there a more than 40 visuals as a default available to use in your report page. >> Lees verder