Power BI | St Johann ski dashboard
I am happy to share with you an exciting new project I’ve been working on – the St Johann in Tirol Power BI dashboard!
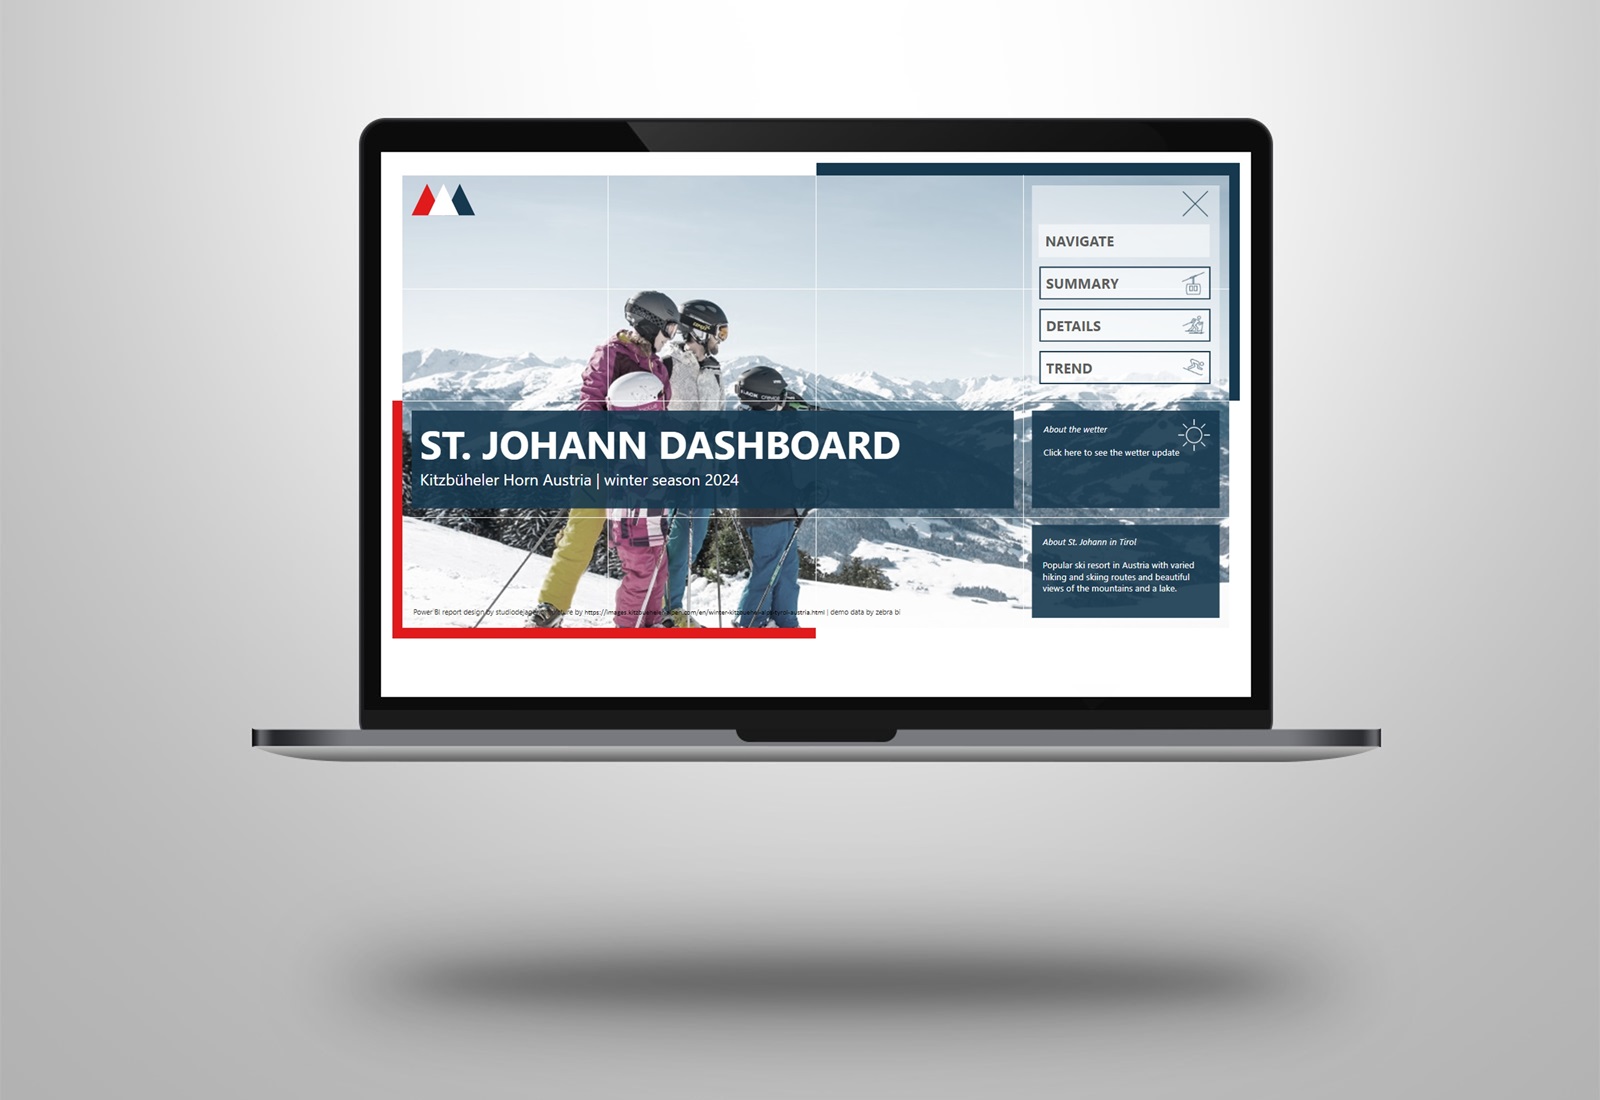
Inspired by the recent visit with my family to the St Johann in Tirol ski area in Austria, I’ve created this website-inspired dashboard that captures the essence of the ski experience.
Merging data elegance with corporate design, I’ve incorporated Zebra BI charts & tables and IBCS – International Business Communication Standards standards to deliver actionable insights in this dashboard.
𝐊𝐞𝐲 𝐅𝐞𝐚𝐭𝐮𝐫𝐞𝐬
✅ Animated logo on the report pages
✅ Corporate design integration
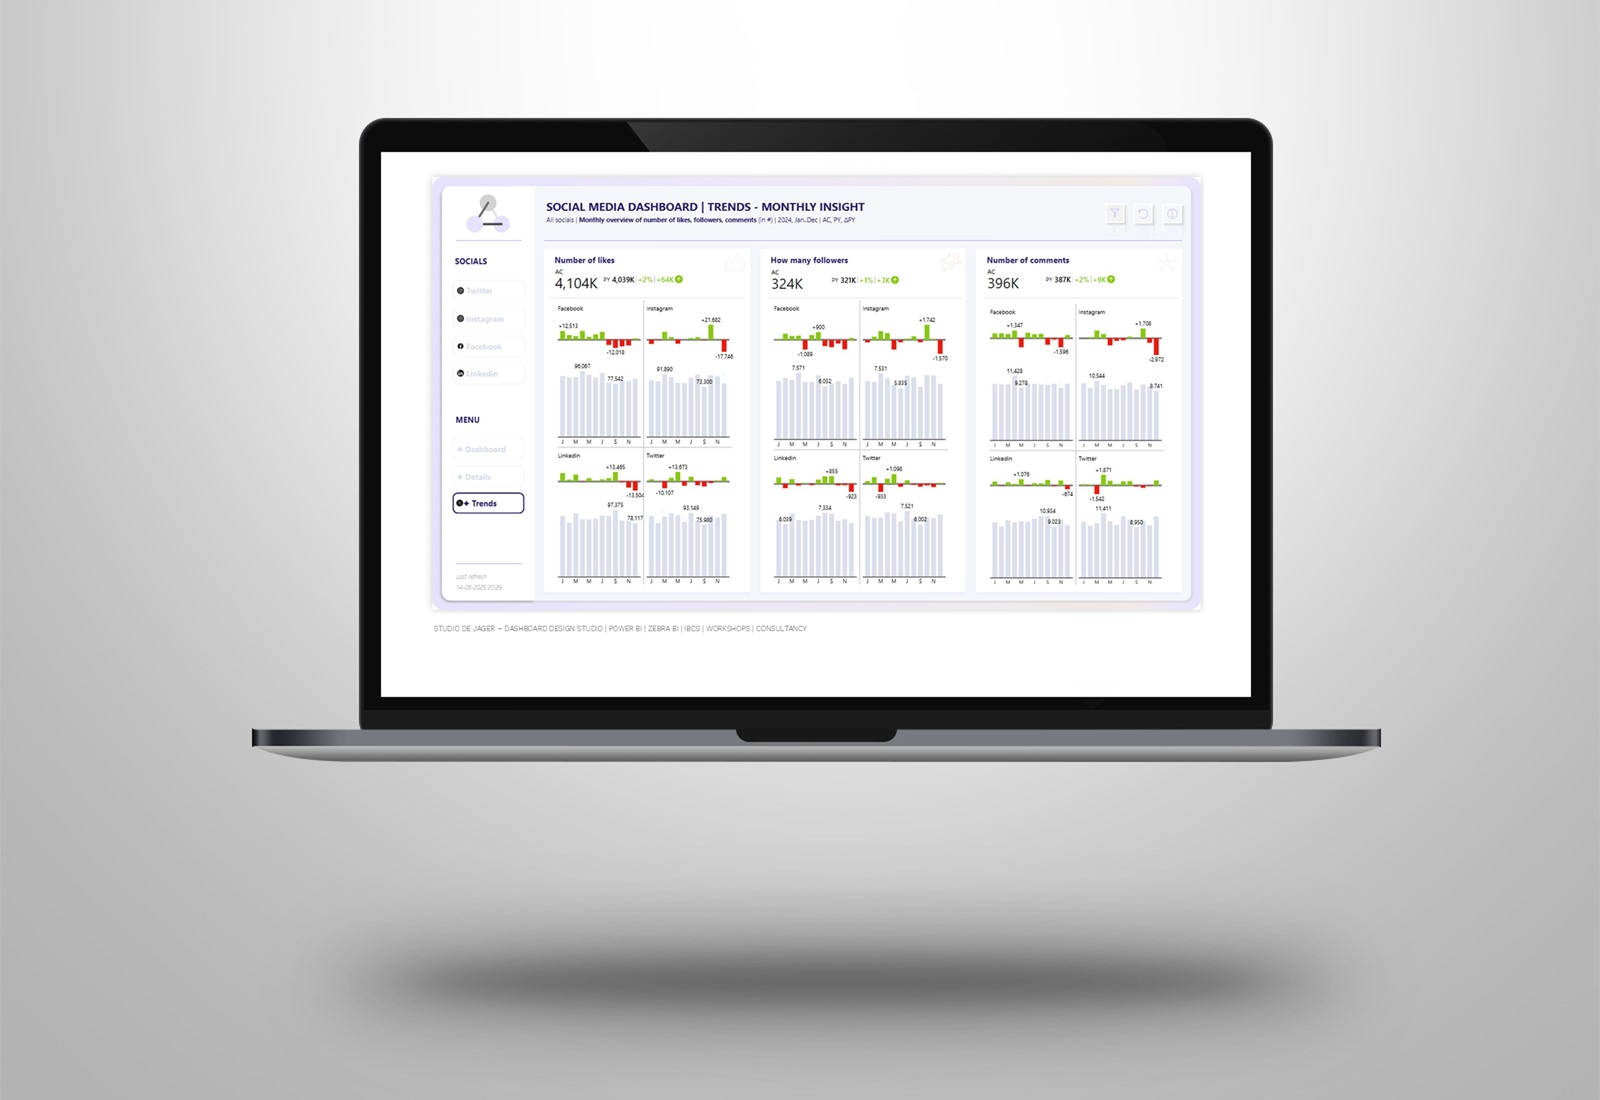
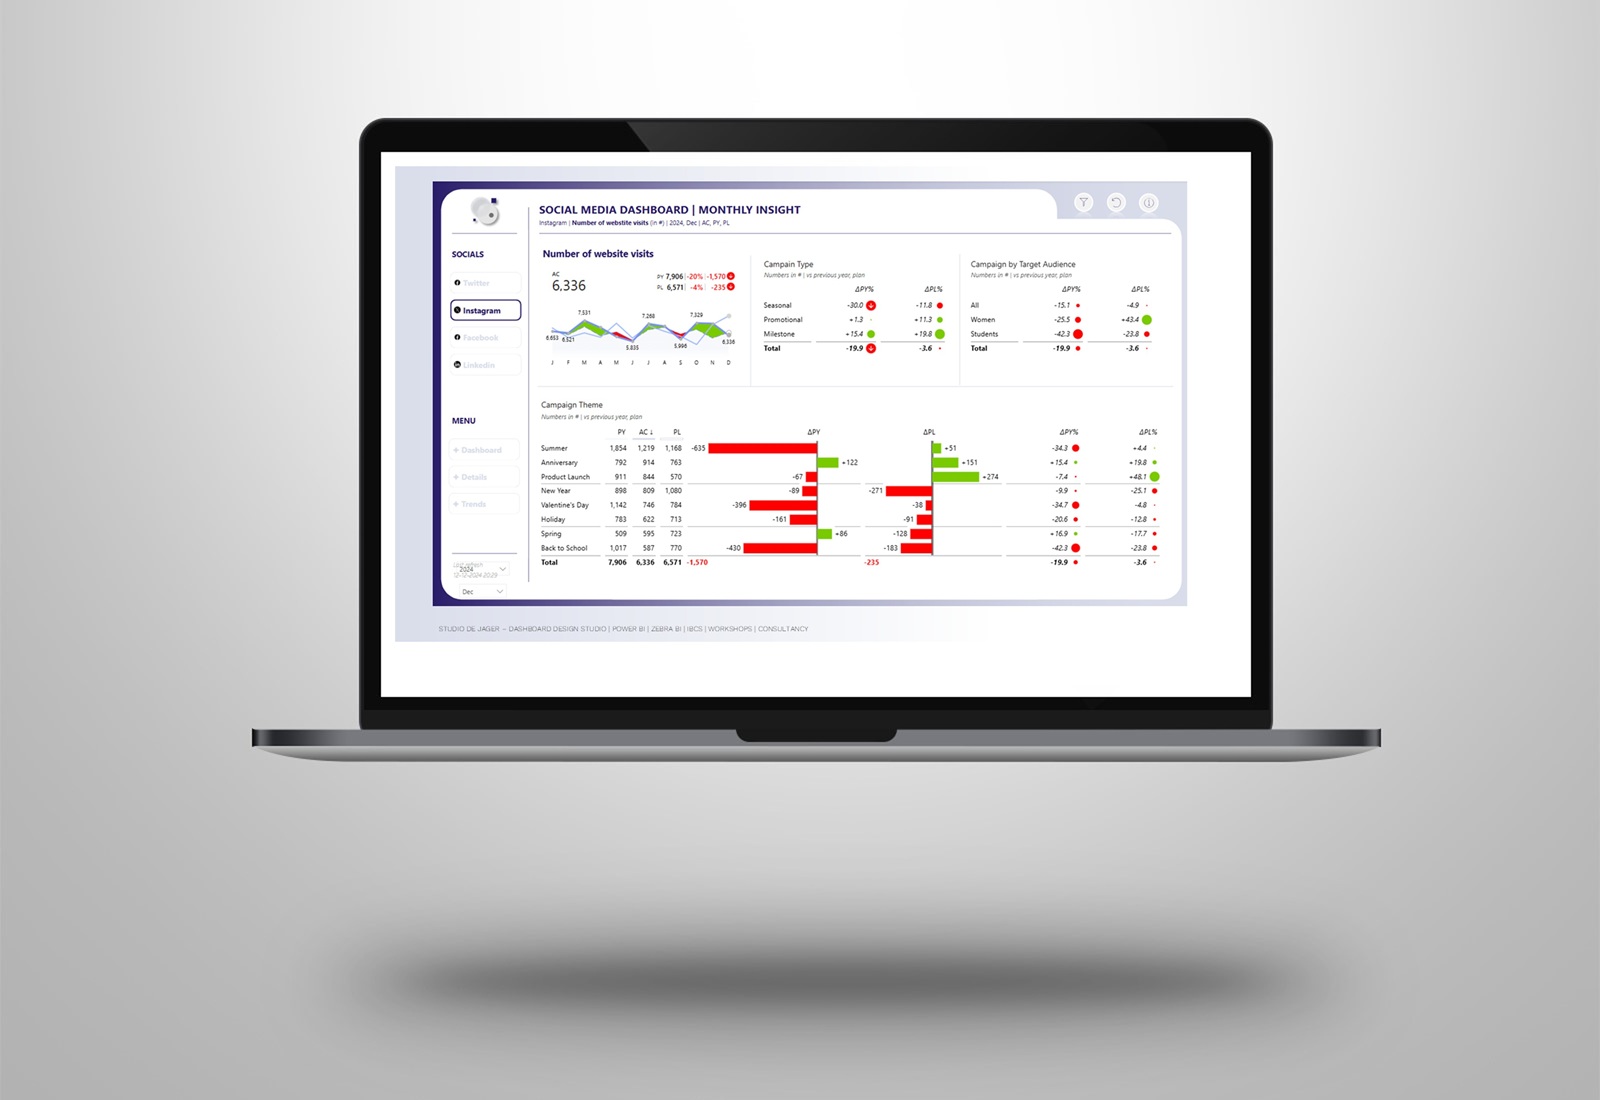
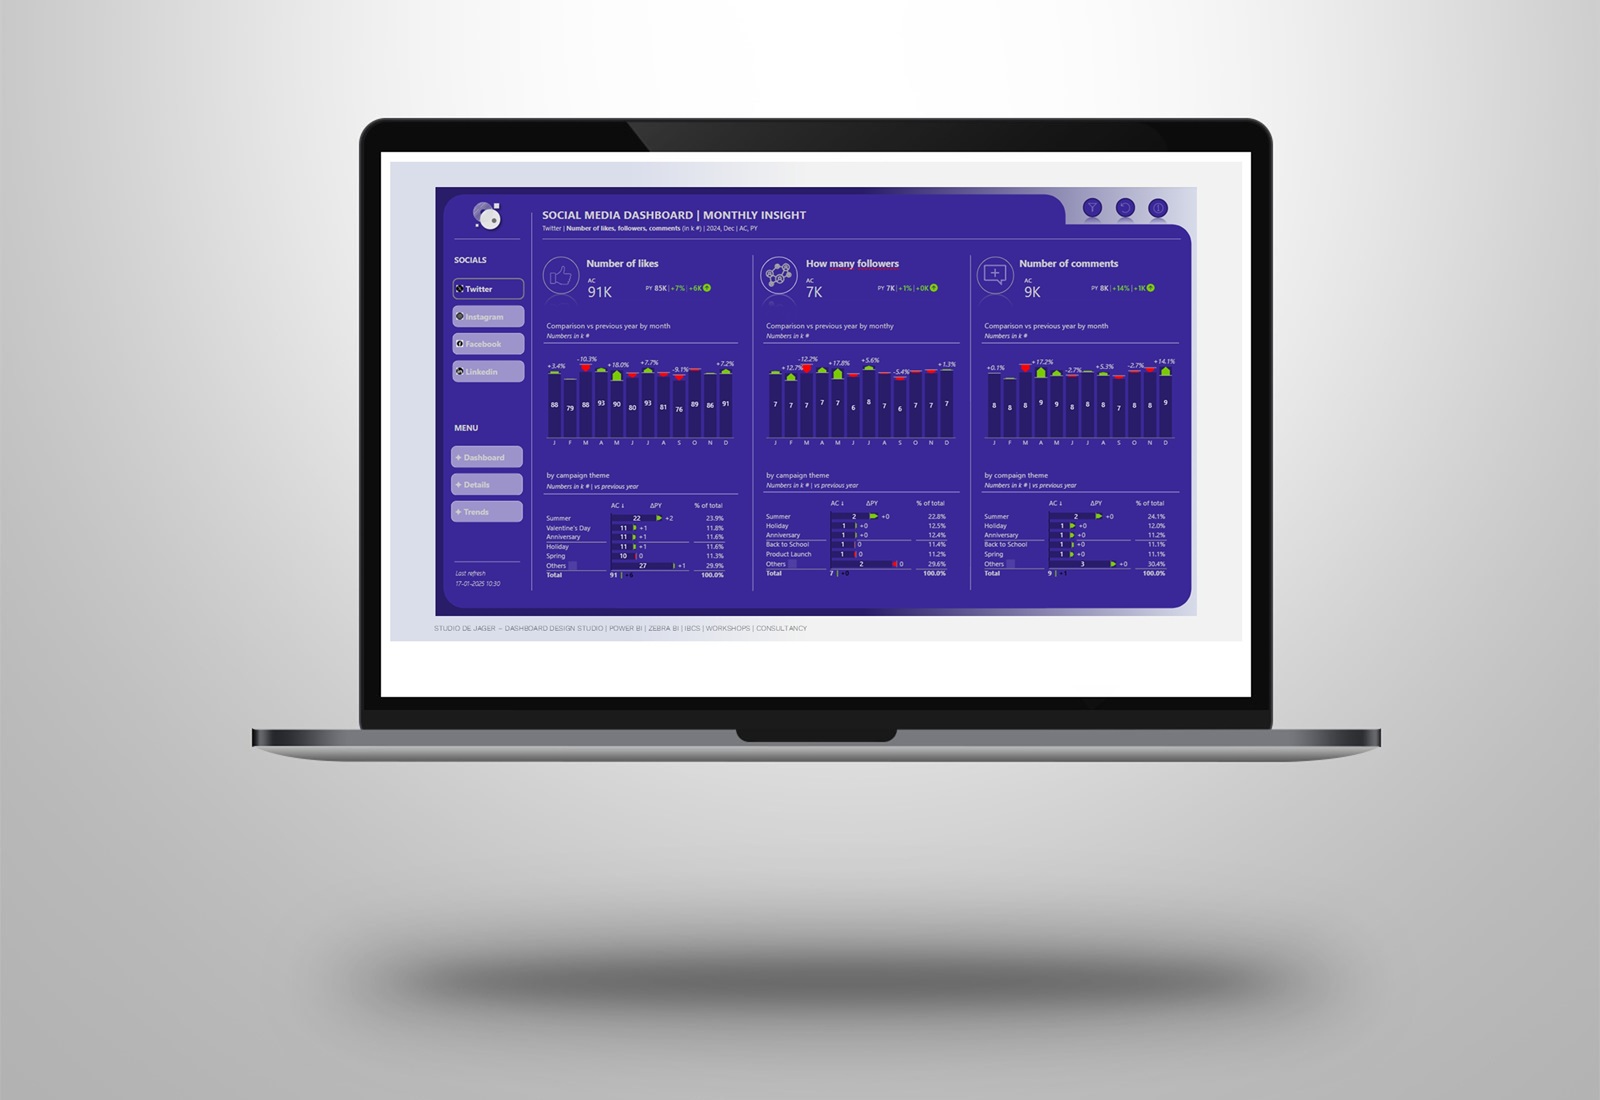
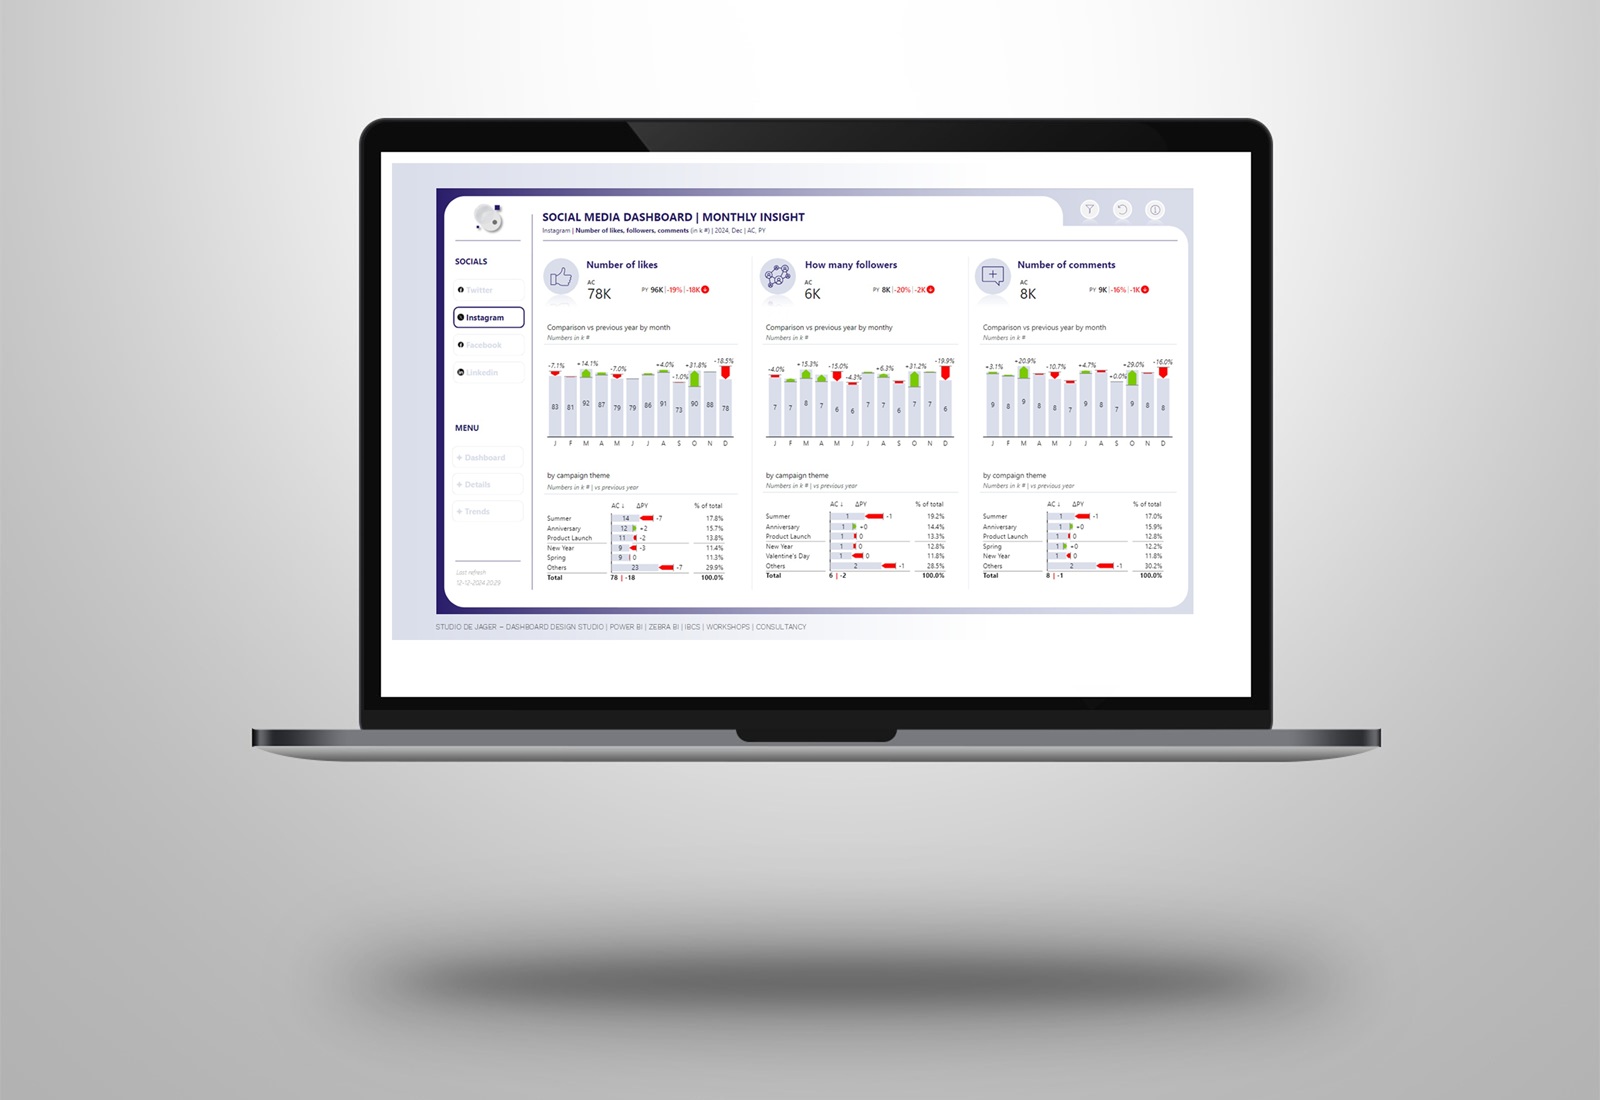
✅ Applying IBCS – International Business Communication Standards with Zebra BI Charts & Tables
𝐀𝐧𝐢𝐦𝐚𝐭𝐞𝐝 𝐥𝐨𝐠𝐨 𝐨𝐧 𝐭𝐡𝐞 𝐫𝐞𝐩𝐨𝐫𝐭 𝐩𝐚𝐠𝐞𝐬: In all the pages you find an animated SVG logo. I’ve made this logo in PowerPoint, transformed it into a SVG file and made it a dynamic using Animista.
𝐂𝐨𝐫𝐩𝐨𝐫𝐚𝐭𝐞 𝐝𝐞𝐬𝐢𝐠𝐧 𝐢𝐧𝐭𝐞𝐠𝐫𝐚𝐭𝐢𝐨𝐧: The dashboard seamlessly incorporates the corporate design of the kitzbueheler website, ensuring a cohesive and visually pleasing experience. To develop a dashboard I often use the website for inspiration and create a one page overview in Powerpoint.
𝐙𝐞𝐛𝐫𝐚 𝐁𝐈 𝐂𝐡𝐚𝐫𝐭𝐬 & 𝐓𝐚𝐛𝐥𝐞𝐬: Elevating data visualization and applying IBCS standards, I’ve used Zebra BI charts and tables to provide a clear and insightful representation of the number of visitors to the ski area. Used fake data in this report.
In the tables you find 𝐯𝐚𝐫𝐢𝐚𝐧𝐜𝐞 𝐜𝐡𝐚𝐫𝐭𝐬 𝐢𝐧𝐭𝐞𝐠𝐫𝐚𝐭𝐞𝐝 𝐢𝐧 𝐭𝐚𝐛𝐥𝐞𝐬. In this way it’s much easier to find the differences between the figures and deliver actionable insights for the viewers. You can create these tables very easy in Power BI with just two measures, 𝘯𝘰 𝘯𝘦𝘦𝘥 𝘵𝘰 𝘶𝘴𝘦 𝘢𝘭𝘭 𝘬𝘪𝘯𝘥𝘴 𝘰𝘧 𝘸𝘰𝘳𝘬𝘢𝘳𝘰𝘶𝘯𝘥𝘴 𝘢𝘯𝘥 𝘋𝘈𝘟 𝘤𝘰𝘥𝘪𝘯𝘨.
Hope you inspire the community with showing some of the possibilities in combining 𝐝𝐞𝐬𝐢𝐠𝐧 & 𝐈𝐁𝐂𝐒 𝐬𝐭𝐚𝐧𝐝𝐚𝐫𝐝𝐬 in Power BI !
I look forward hearing your thoughts and feedback!
Sasjah de Jager
Report & dashboard design | Official Zebra BI Partner | Power BI – Excel | IBCS Certified Analyst | Data visualization | Interim business consultancy
Let’s create better reports & dashboards !