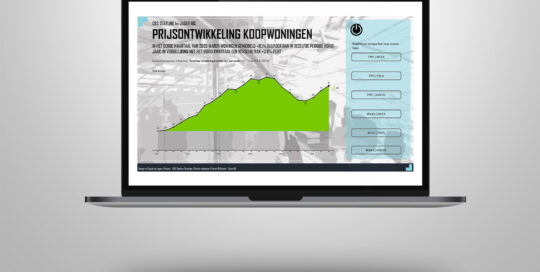
our expertise Vorig week las ik een publicatie van het CBS omtrent de ontwikkeling van de prijs van koopwoningen. Deze publicatie werd vervolgens in veel andere media 1 op 1 overgenomen. Mij zijn veel dezelfde tekst citaten opgevallen, maar haast nergens zag ik een visualisatie ter ondersteuning van de boodschap. Zonde want het >> Lees verder
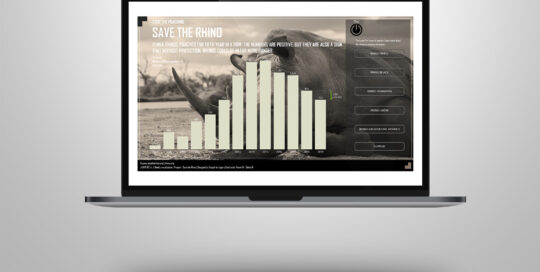
Save the rhino – stop the poaching
Sasja Jager, de2021-03-18T11:57:22+01:00our expertise Last week it was World Ranger Day 2020. I read an article about the brave men and women who are doing their best to stop the poaching of rhinos. Did you know that every 10 hours a rhino is poached? This week’s I decided to make a visualization of it and >> Lees verder
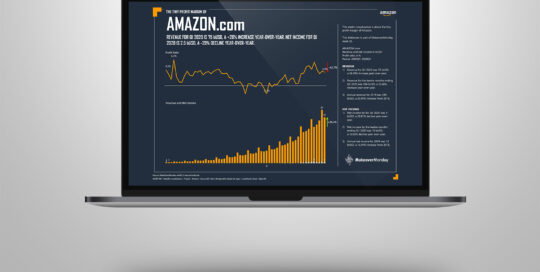
Visualizing the tiny profit margin of Amazon.com
Sasja Jager, de2021-03-18T11:57:08+01:00our expertise This week’s visualization is about the tiny profit margin of Amazon.com as part of MakeoverMonday week 25. This week I used the charts of Zebra BI to show the development of the revenue and the profit margin. As a difference to the original Viz I created a separate line chart with >> Lees verder