Less is more ..... Effective dashboards go beyond aesthetics as they combine 𝐔𝐗 - 𝐔𝐈 𝐝𝐞𝐬𝐢𝐠𝐧 with 𝐚𝐜𝐭𝐢𝐨𝐧𝐚𝐛𝐥𝐞 𝐢𝐧𝐬𝐢𝐠𝐡𝐭𝐬 to drive decisions. So how can you create such dashboards that it is still actionable? As a IBCS – International Business Communication Standards specialist I think that actionability should still be the most important >> Lees verder
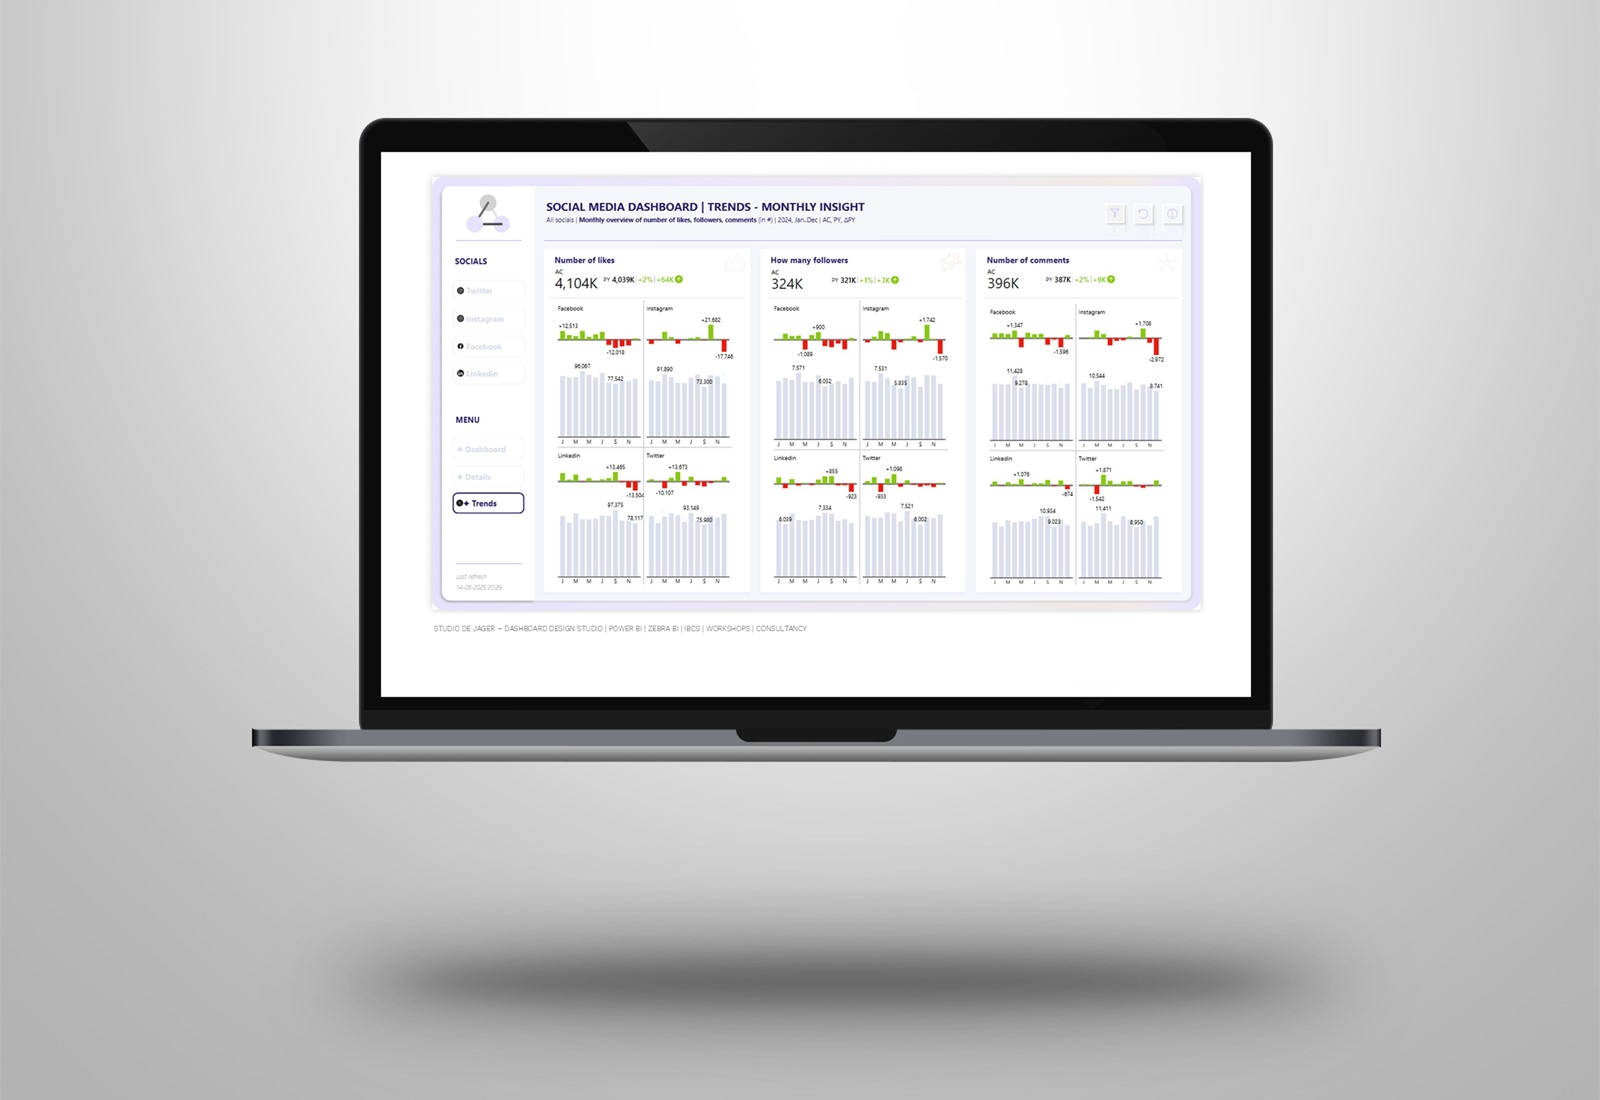
Power BI | Action dots are here – a must have for your dashboards
Sasja Jager, de2025-11-14T15:18:36+01:00Effective dashboards go beyond aesthetics as they combine UX/UI design with 𝐚𝐜𝐭𝐢𝐨𝐧𝐚𝐛𝐥𝐞 𝐢𝐧𝐬𝐢𝐠𝐡𝐭𝐬 to drive decisions. Zebra BI latest product update brings an innovative way to 𝐯𝐢𝐬𝐮𝐚𝐥𝐢𝐳𝐞 𝐯𝐚𝐫𝐢𝐚𝐧𝐜𝐞𝐬 with Action dots. Action dots transform raw numbers into clear, visual insights, making variance tracking more 𝐢𝐧𝐭𝐮𝐢𝐭𝐢𝐯𝐞 𝐚𝐧𝐝 𝐞𝐟𝐟𝐢𝐜𝐢𝐞𝐧𝐭, especially for dashboards where space is tight. >> Lees verder
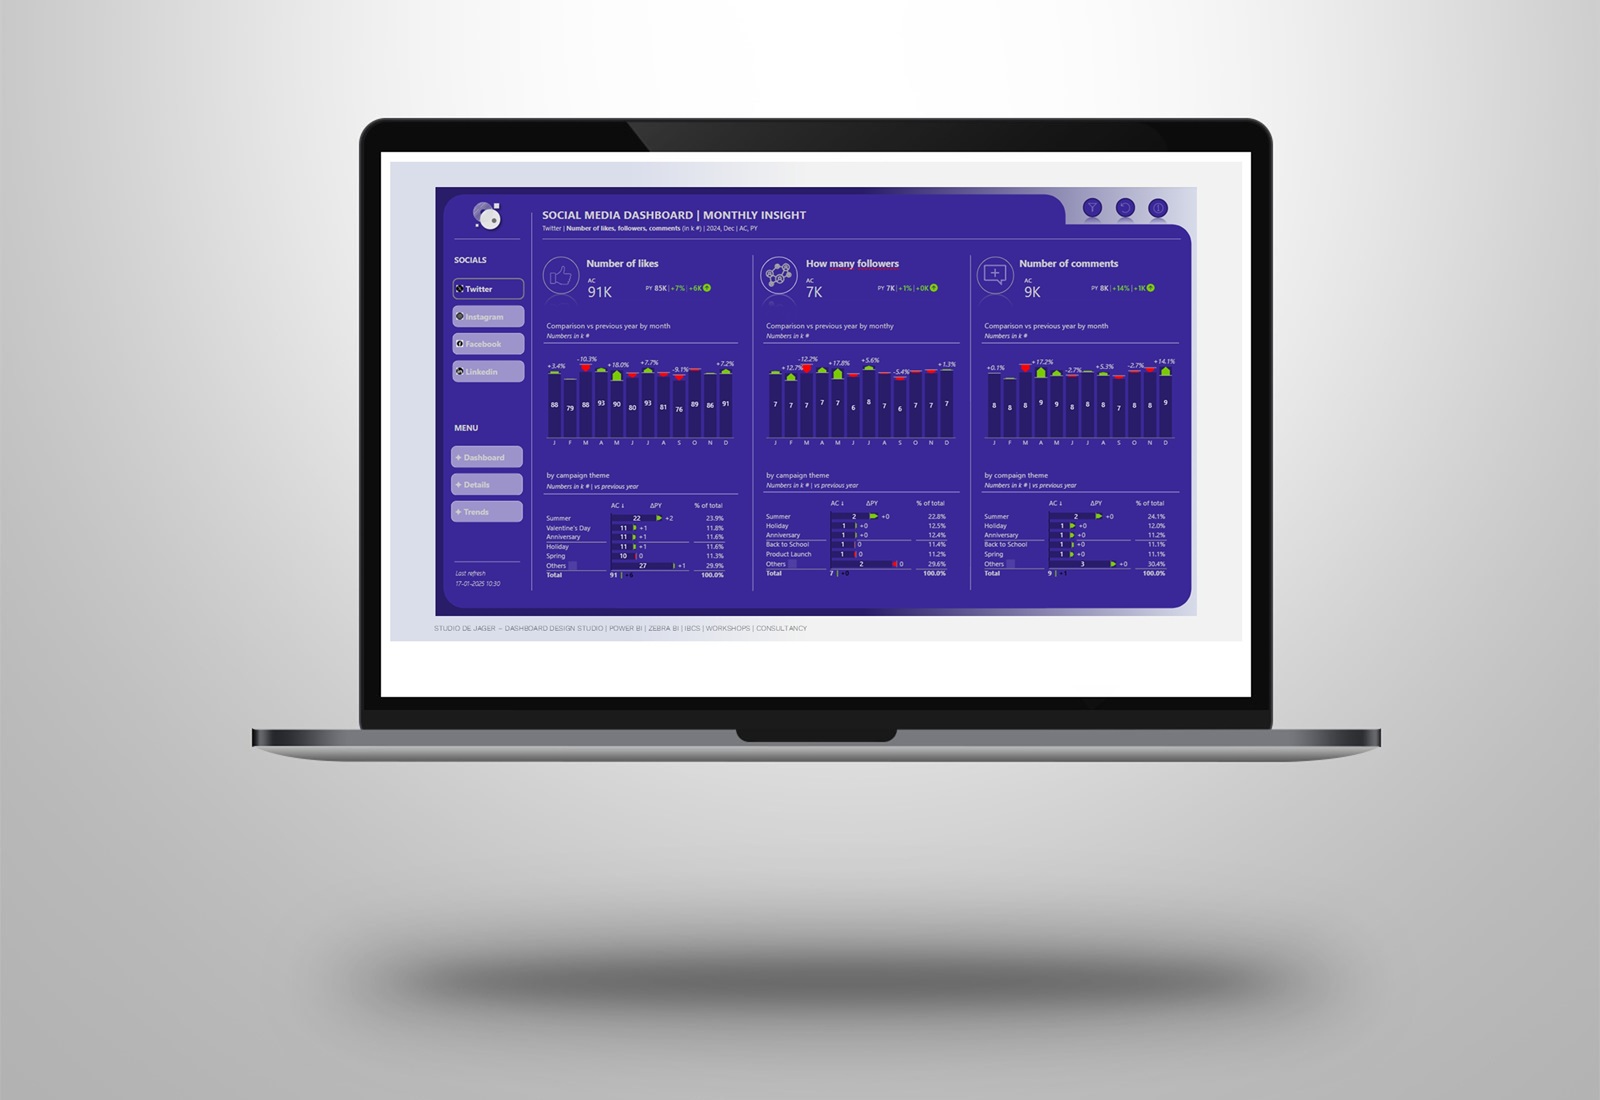
Power BI dashboard design | When – dark theme – design meets actionability
Sasja Jager, de2025-11-14T15:10:54+01:00The motto "𝙈𝙖𝙠𝙚 𝙮𝙤𝙪𝙧 𝙋𝙤𝙬𝙚𝙧 𝘽𝙄 𝙧𝙚𝙥𝙤𝙧𝙩𝙨 𝙣𝙤𝙩 𝙡𝙤𝙤𝙠 𝙡𝙞𝙠𝙚 𝙋𝙤𝙬𝙚𝙧 𝘽𝙄!" as Nicholas Lea-Trengrouse stated is something I really like. Follow Nicholas because he creates amazing dashboard examples. Effective dashboards go beyond aesthetics as they combine UX/UI design with actionable insights to drive decisions. So how can you create such dashboards that >> Lees verder
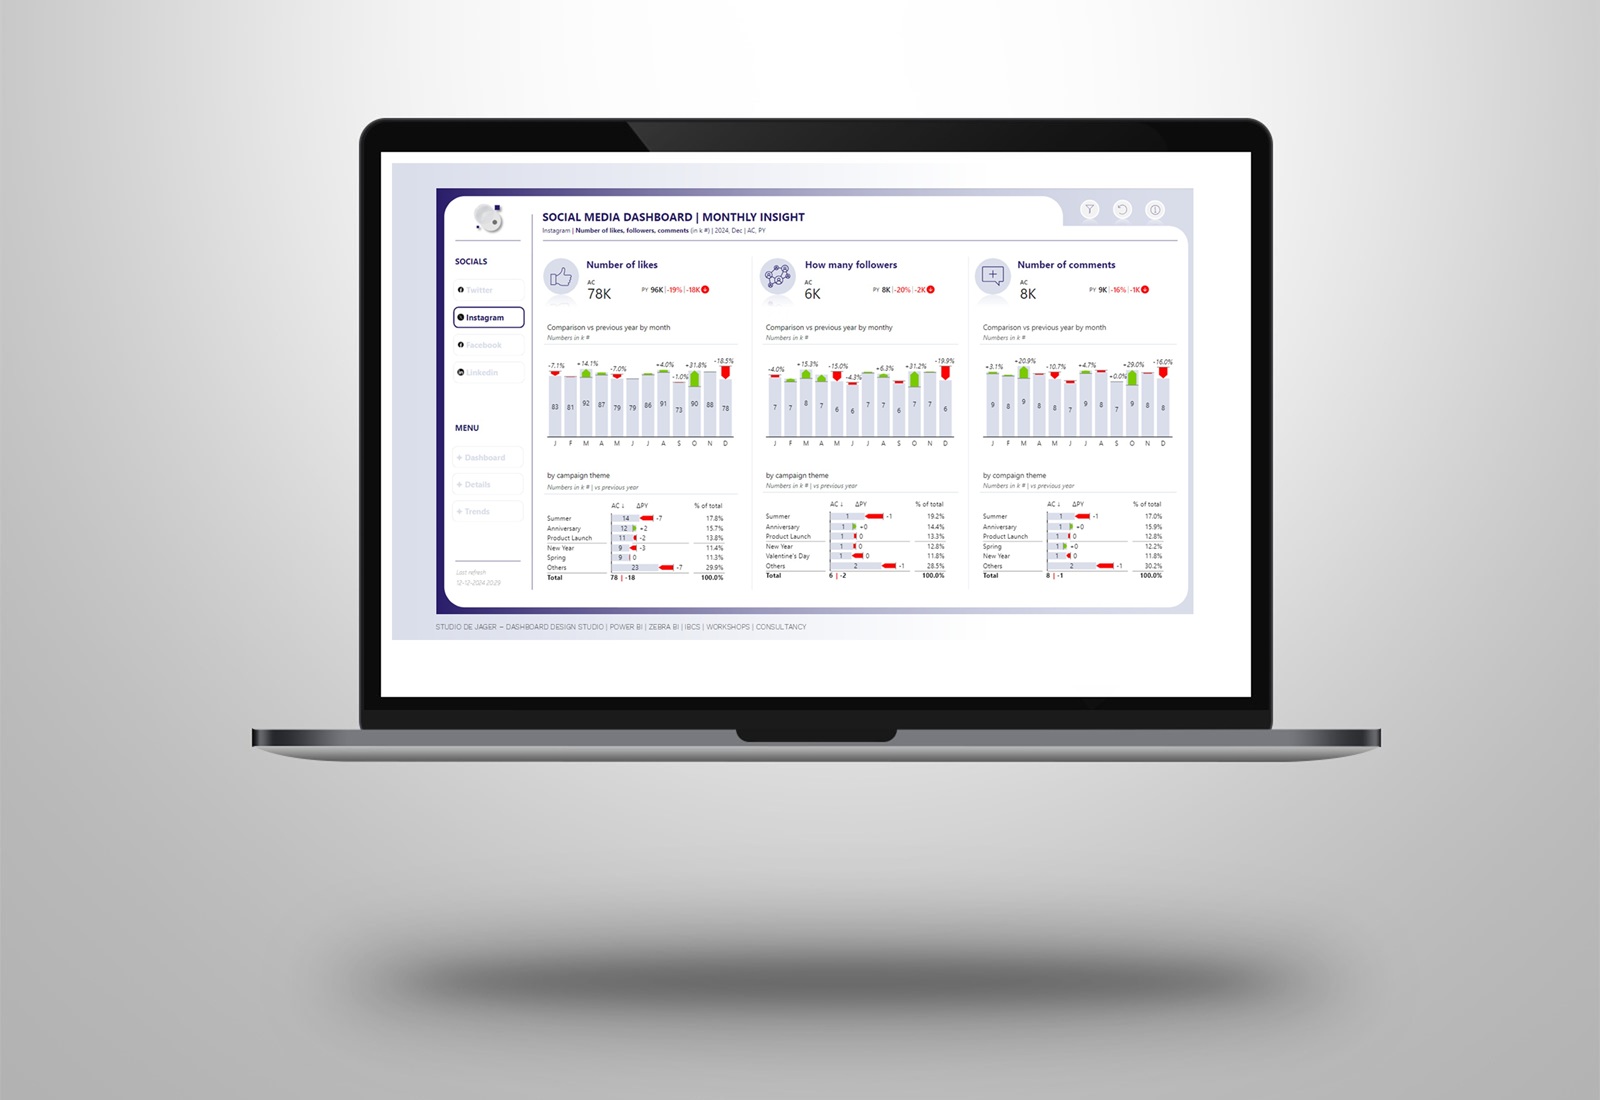
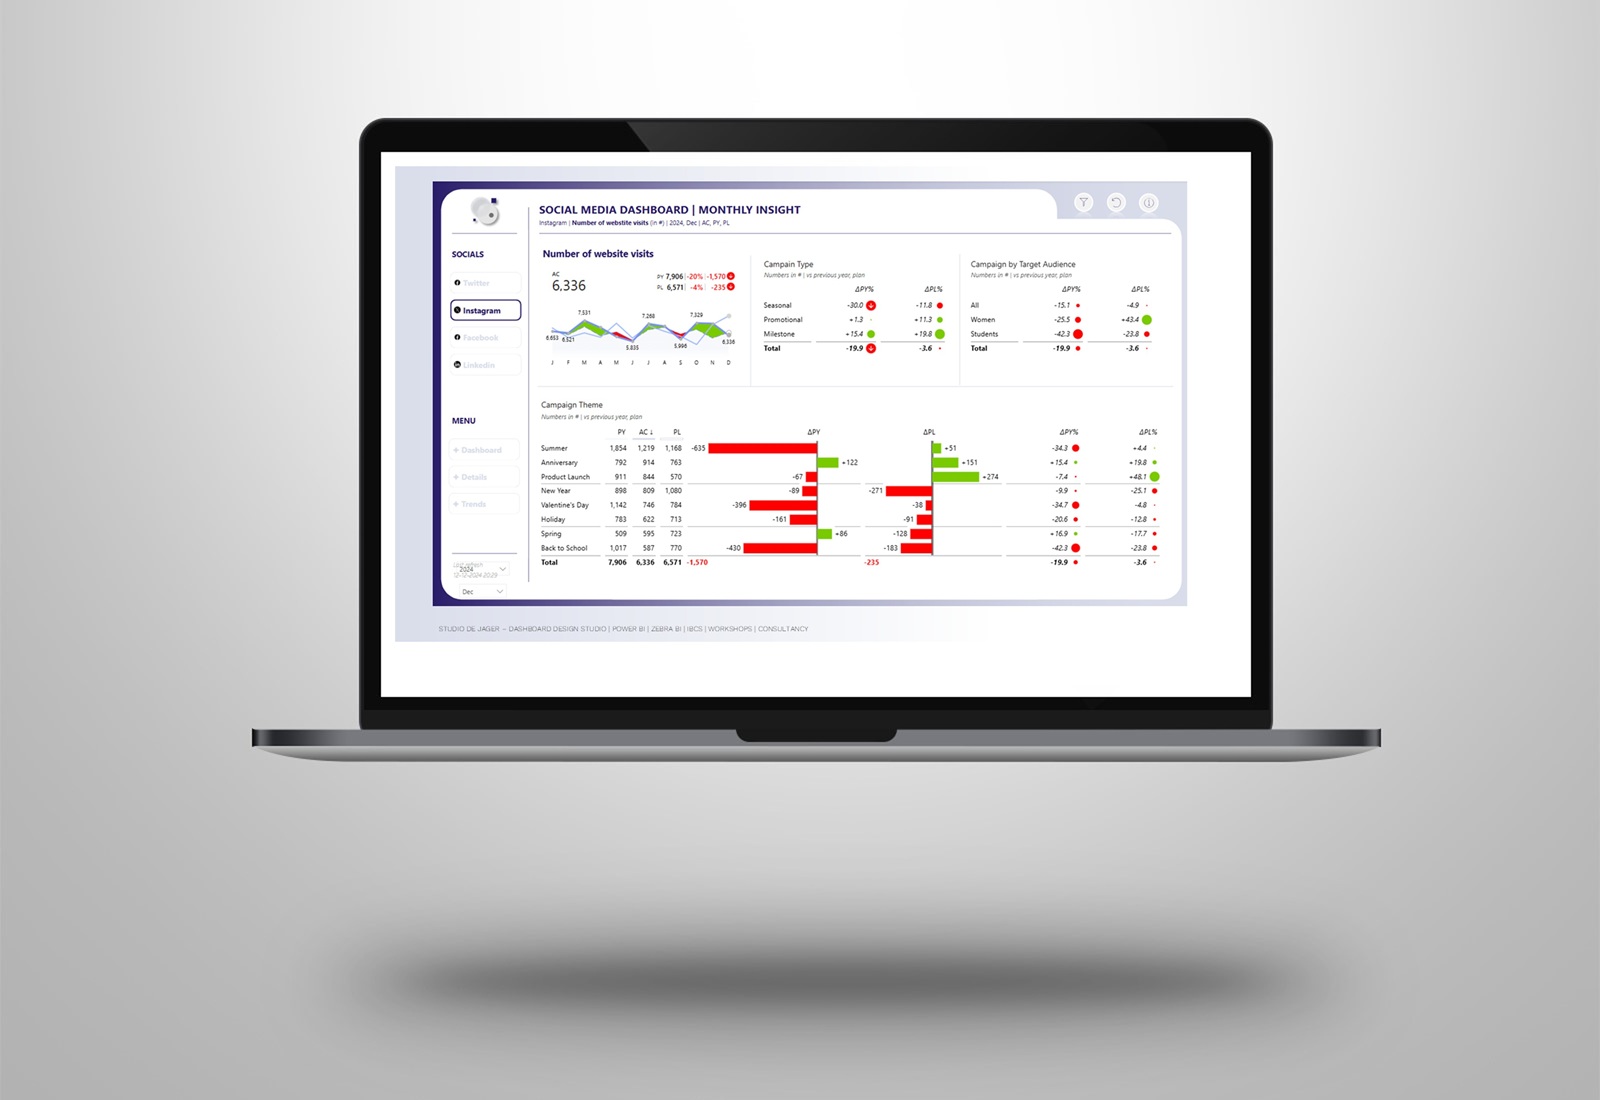
Power BI dashboard design | When design meets actionability
Sasja Jager, de2025-11-14T15:06:38+01:00The motto "𝙈𝙖𝙠𝙚 𝙮𝙤𝙪𝙧 𝙋𝙤𝙬𝙚𝙧 𝘽𝙄 𝙧𝙚𝙥𝙤𝙧𝙩𝙨 𝙣𝙤𝙩 𝙡𝙤𝙤𝙠 𝙡𝙞𝙠𝙚 𝙋𝙤𝙬𝙚𝙧 𝘽𝙄!" as Nicholas Lea-Trengrouse stated is something I really like. Follow Nicholas because he creates amazing dashboard examples. Effective dashboards go beyond aesthetics as they combine UX/UI design with actionable insights to drive decisions. So how can you create such dashboards that >> Lees verder
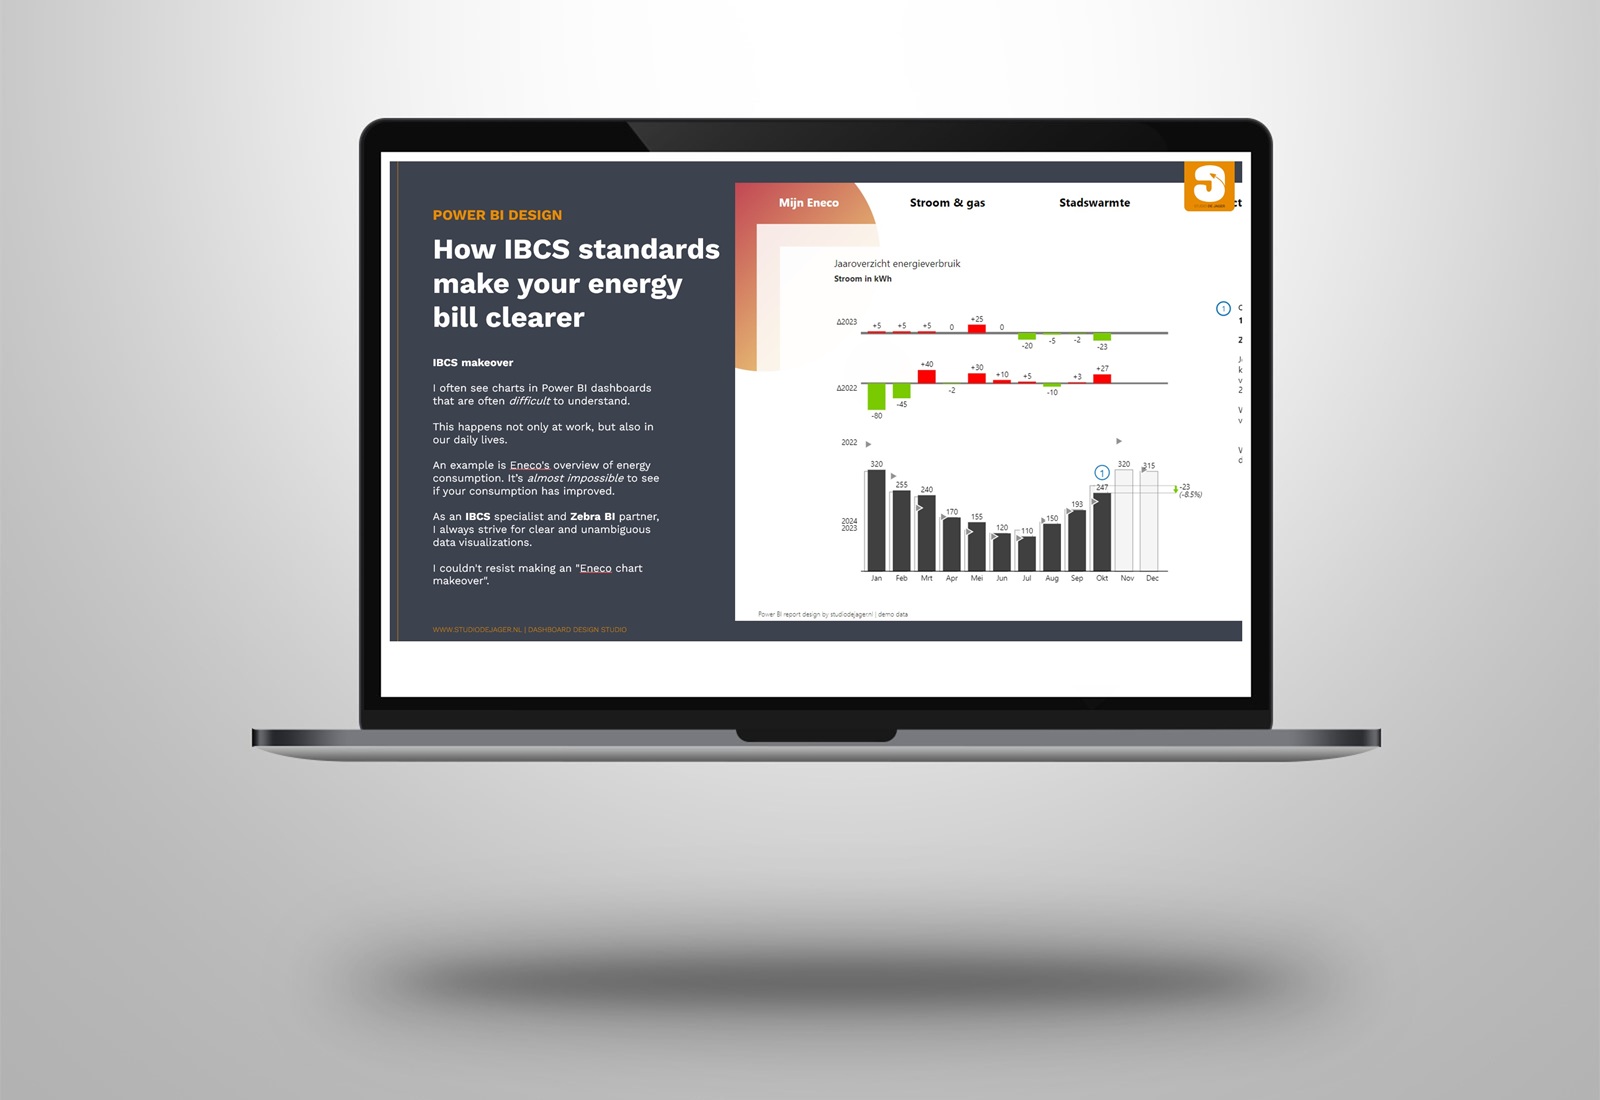
Power BI | How IBCS standards make yor energy bill clearer
Sasja Jager, de2025-11-14T14:50:49+01:00I often see graphs in dashboards that are 𝐨𝐟𝐭𝐞𝐧 𝐝𝐢𝐟𝐟𝐢𝐜𝐮𝐥𝐭 𝐭𝐨 𝐮𝐧𝐝𝐞𝐫𝐬𝐭𝐚𝐧𝐝. This happens not only at work, but also in our daily lives. Last week I received the monthly overview from Eneco with a chart showing the development of energy consumption. At first glance a lot of useful information. 𝐁𝐮𝐭 𝐜𝐚𝐧 𝐲𝐨𝐮 >> Lees verder
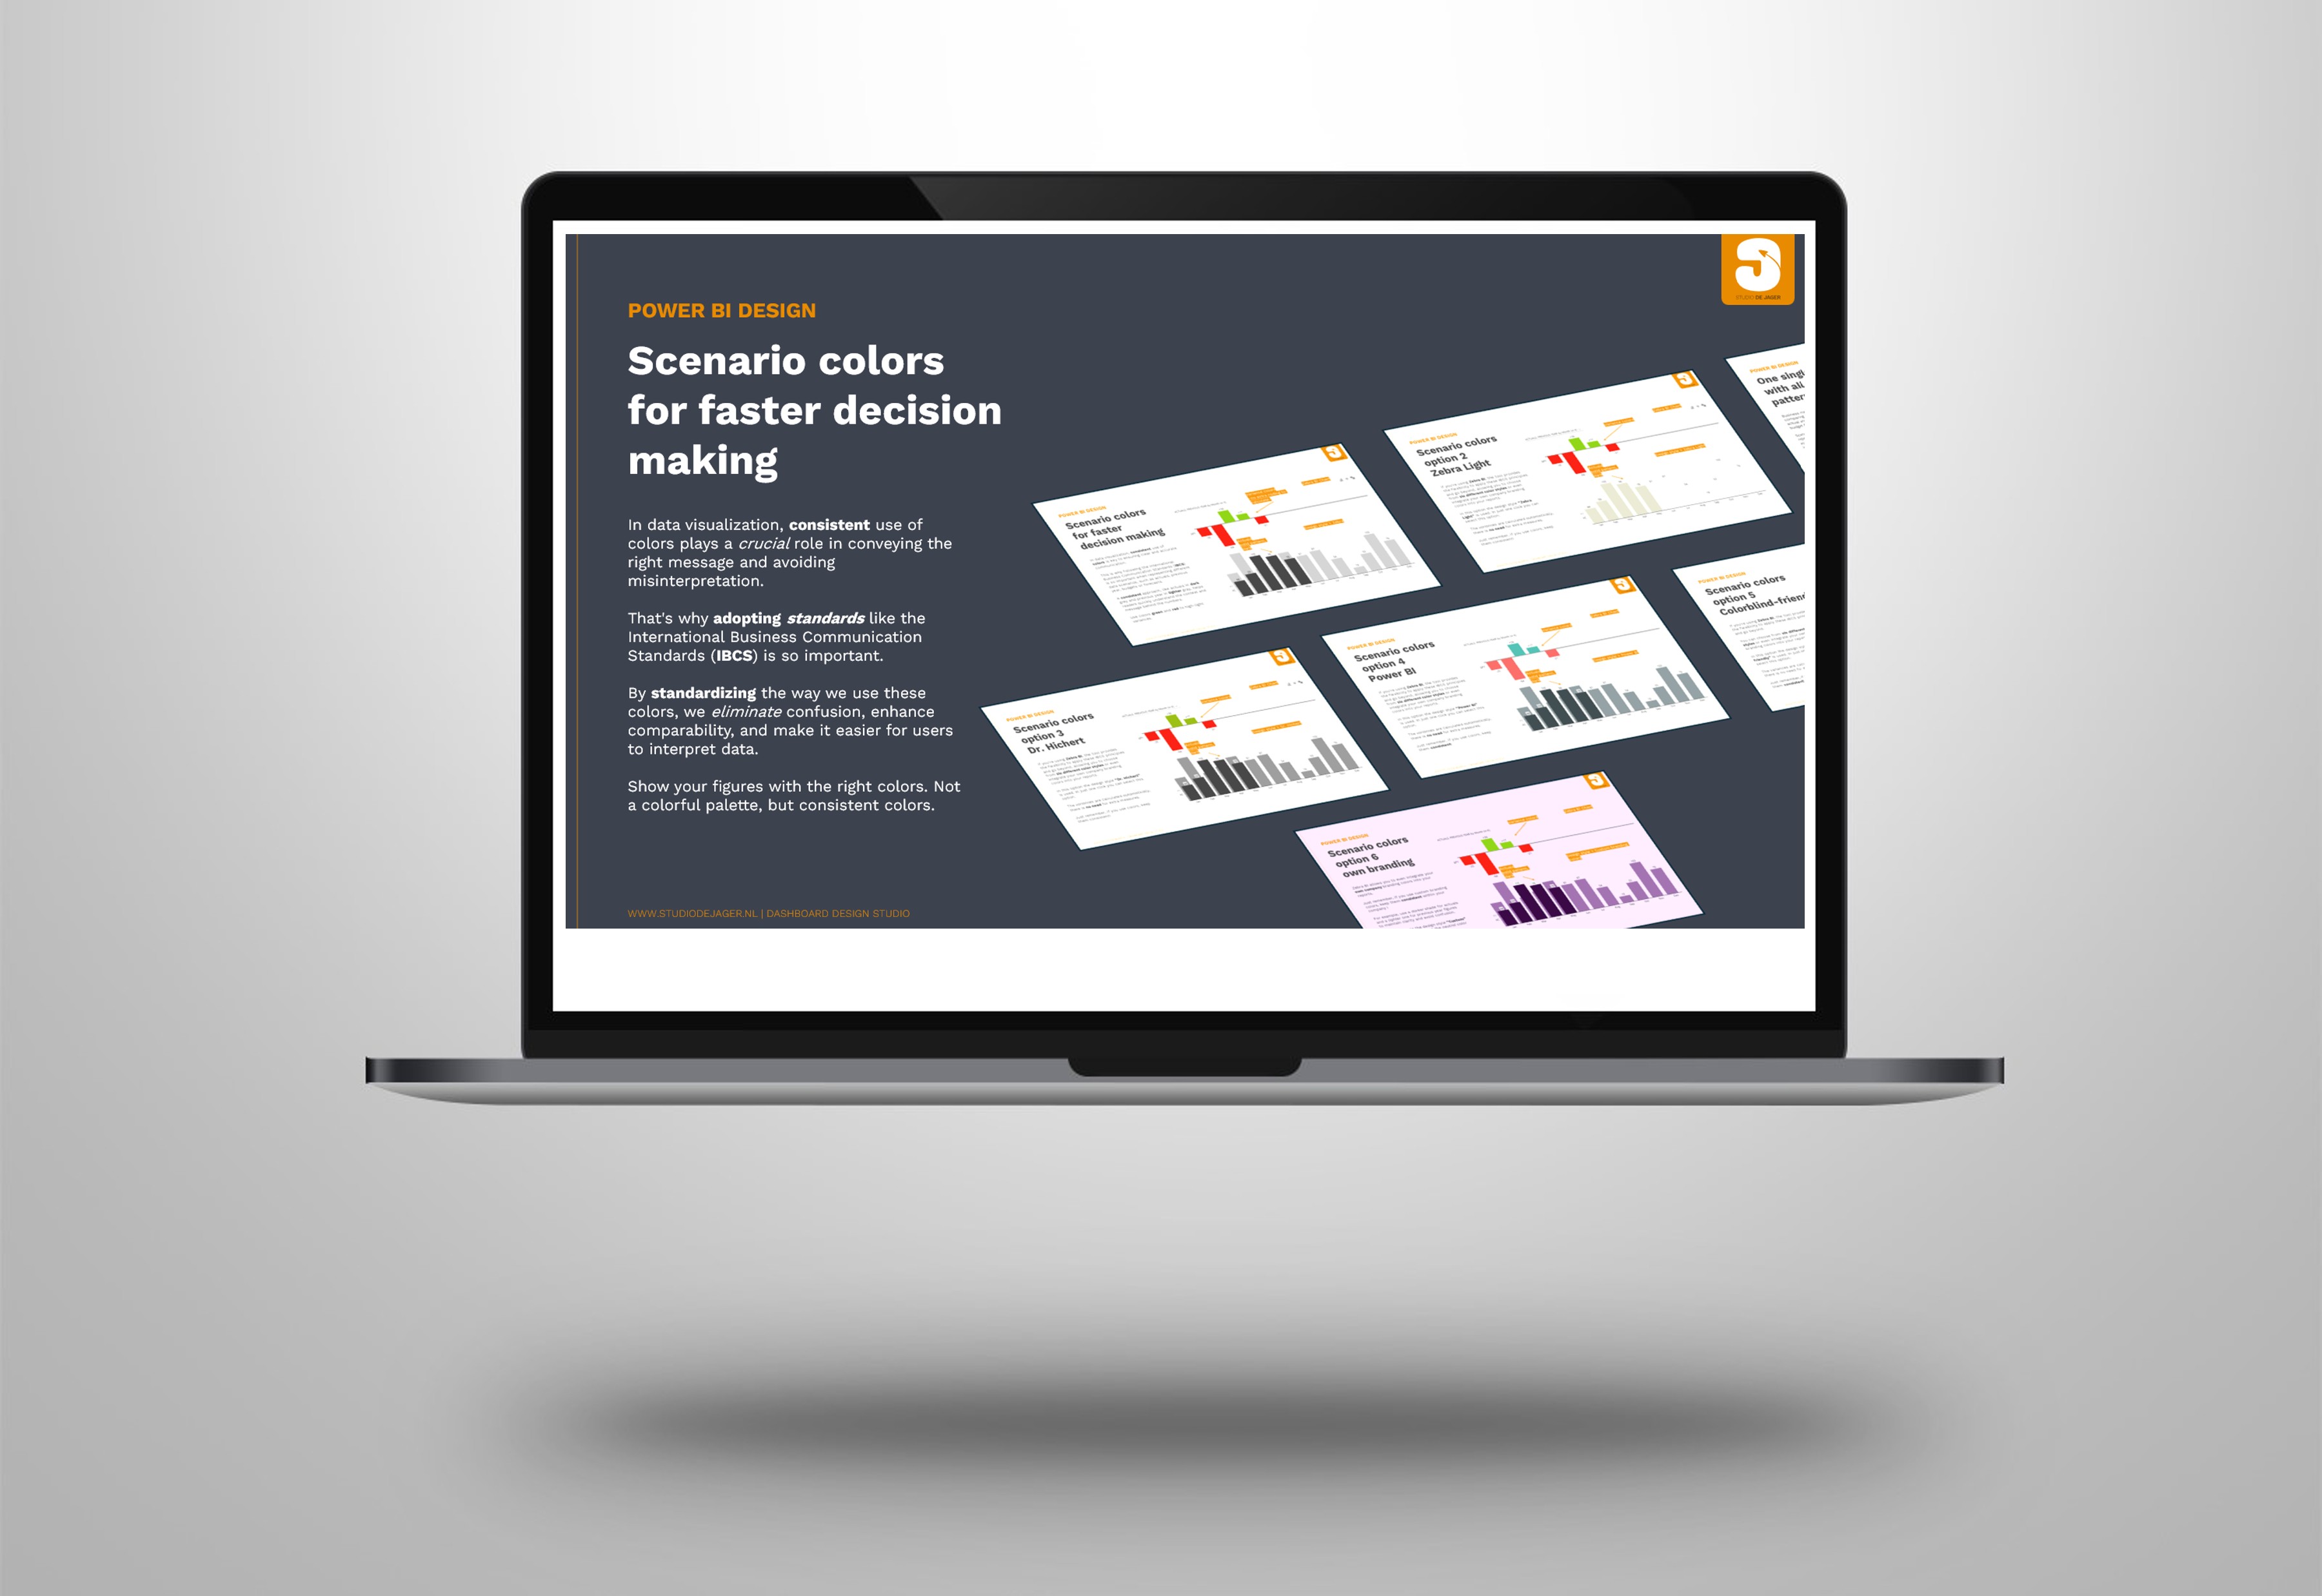
Power BI | The power of scenario colors
Sasja Jager, de2025-11-14T14:49:37+01:00In data visualization, 𝐜𝐨𝐧𝐬𝐢𝐬𝐭𝐞𝐧𝐭 𝐮𝐬𝐞 𝐨𝐟 𝐜𝐨𝐥𝐨𝐫𝐬 is key to ensuring clear and accurate communication. This is why following the IBCS – International Business Communication Standards is so important when representing different data scenarios, such as actuals, previous year, budgets, and forecasts. A 𝐜𝐨𝐧𝐬𝐢𝐬𝐭𝐞𝐧𝐭 𝐚𝐩𝐩𝐫𝐨𝐚𝐜𝐡, like actuals in dark grey and previous year >> Lees verder
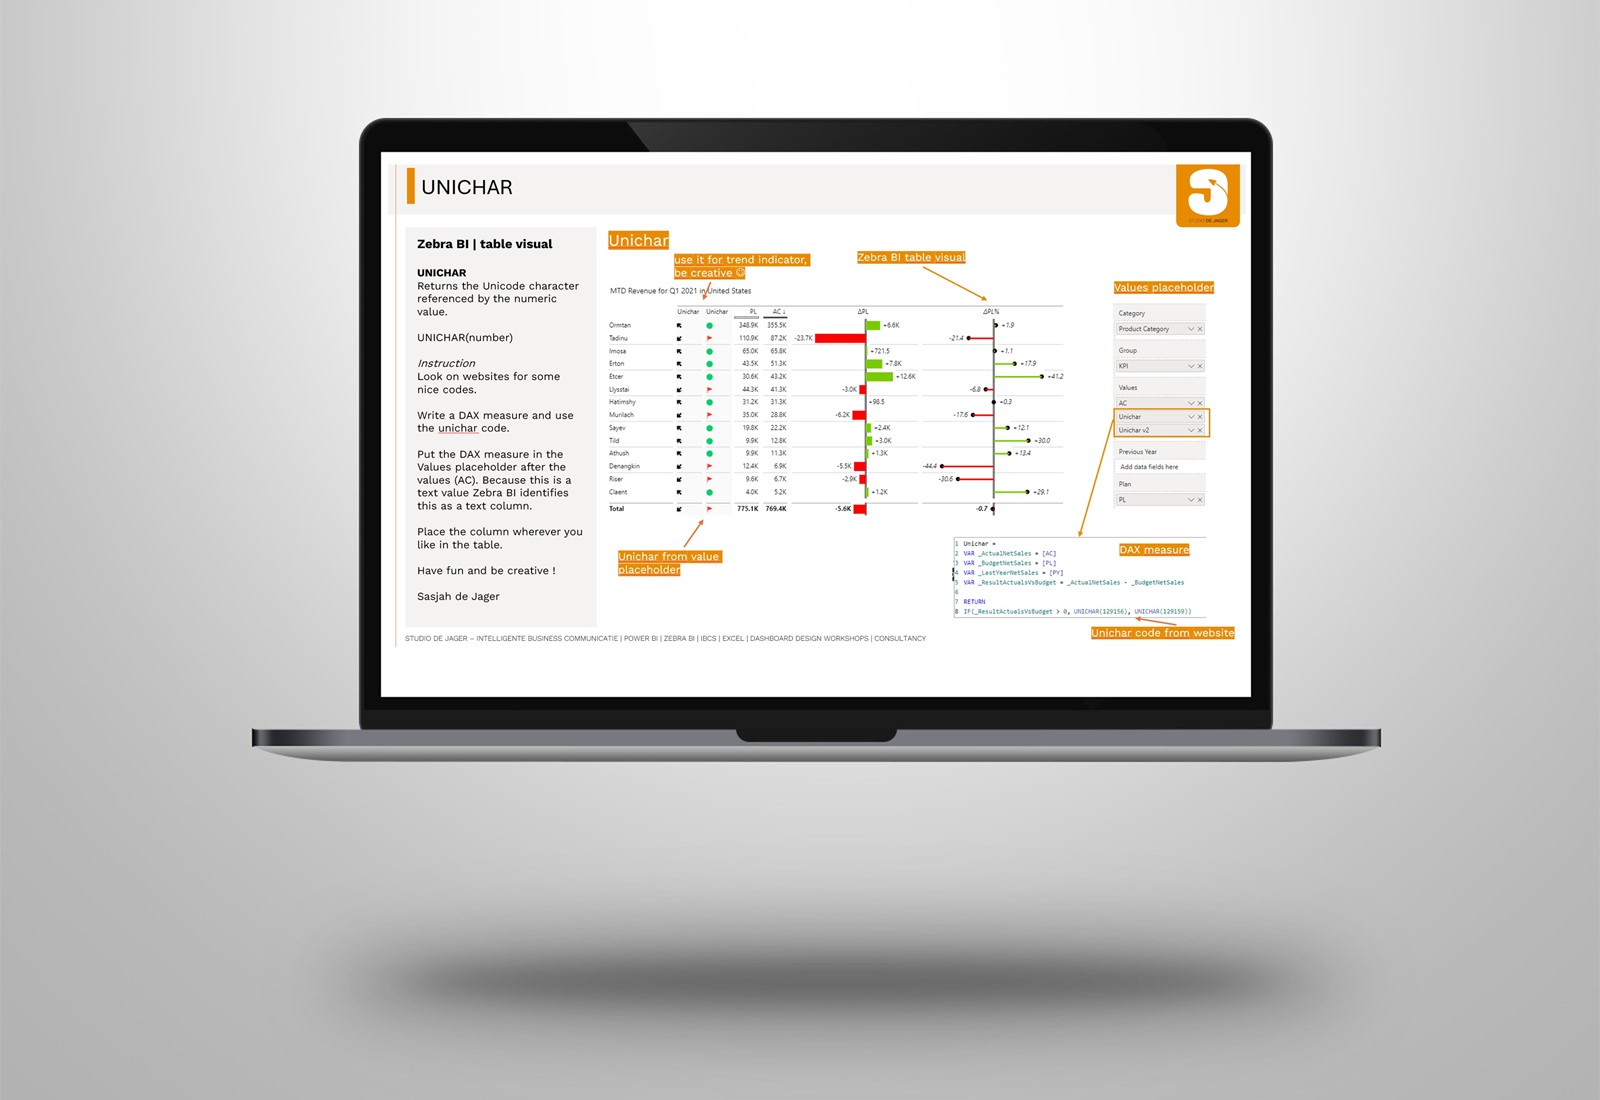
Power BI | Zebra BI table with unichar, Unicode & emoji’s
Sasja Jager, de2025-11-14T14:43:21+01:00Attention to design is important in Power BI reports. I'm always looking for the opportunity to add something extra to a report. Let’s share a couple of ideas for Zebra BI users. Having the possibility to 𝐝𝐢𝐬𝐩𝐥𝐚𝐲 𝐚𝐝𝐝𝐢𝐭𝐢𝐨𝐧𝐚𝐥 𝐚𝐭𝐭𝐫𝐢𝐛𝐮𝐭𝐞𝐬 in Zebra BI table visuals is crucial for a 𝐟𝐚𝐬𝐭𝐞𝐫 and 𝐞𝐚𝐬𝐢𝐞𝐫 understanding of data. With >> Lees verder
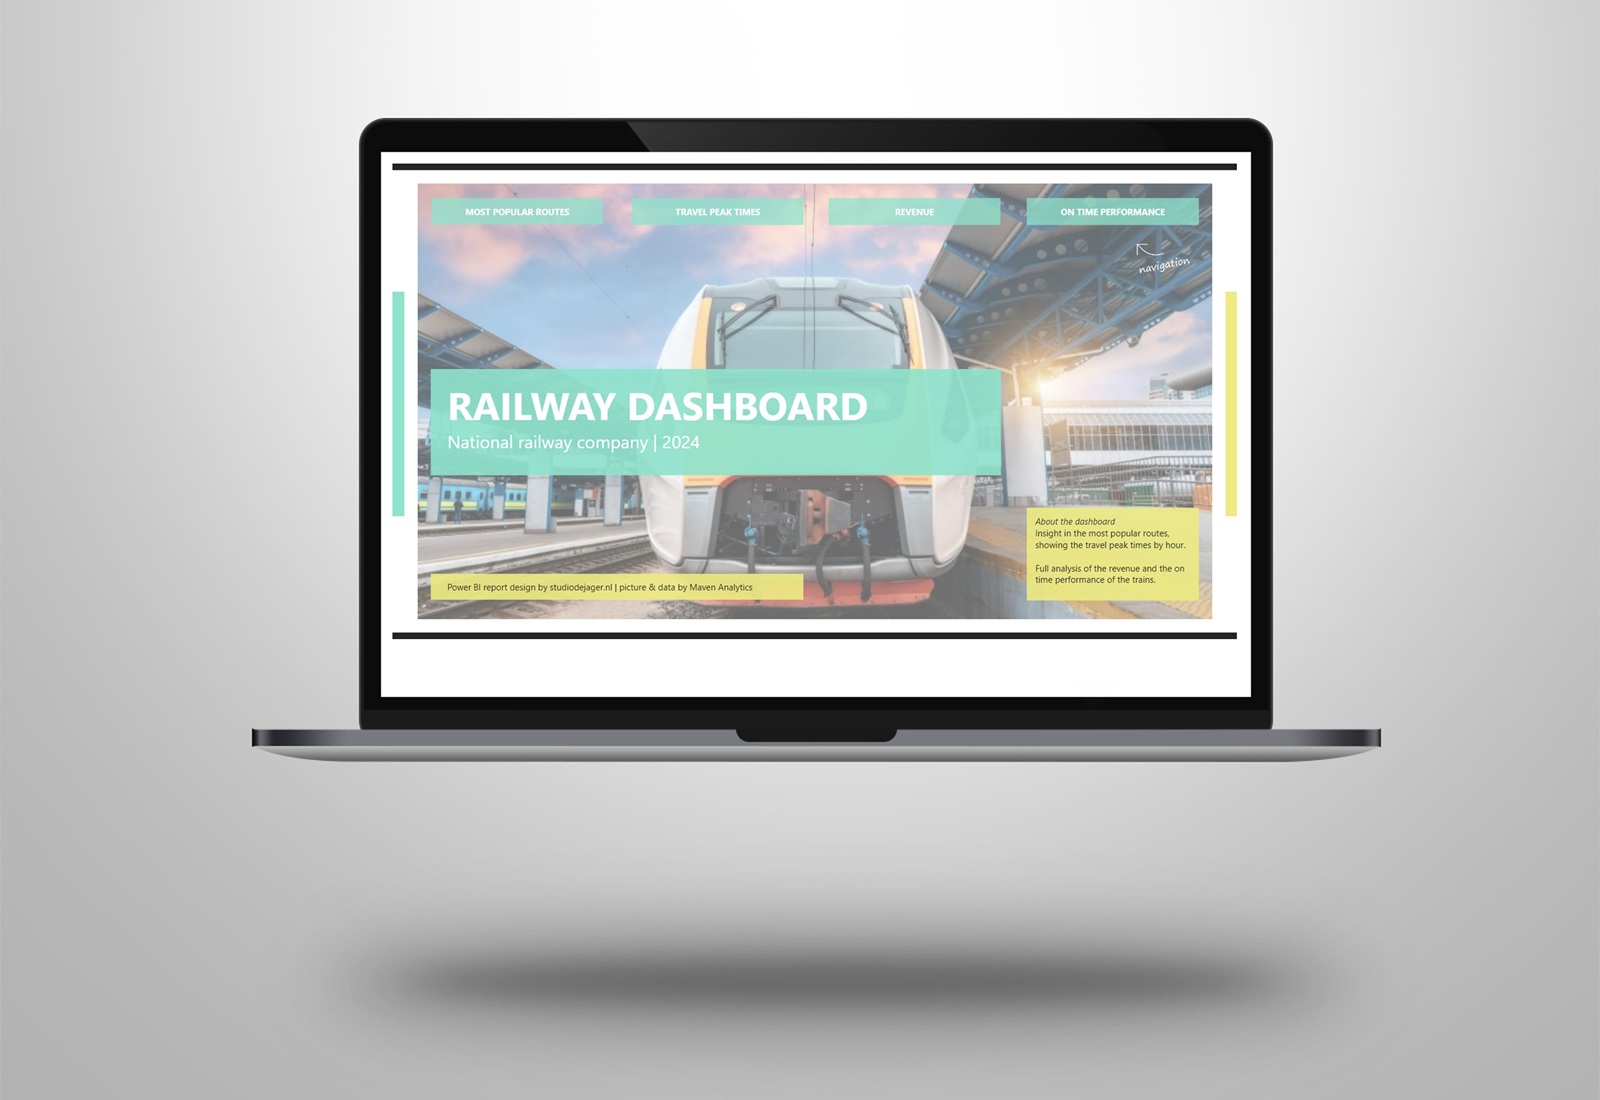
Power BI | Participating in Maven Railway Challenge
Sasja Jager, de2025-11-14T14:35:08+01:00Last Maven Analytics challenge I had some problems with uploading my entry on time and unfortunately I couldn't participate. This time (Branislav Poljašević) I'm on time and I want to participate in the new challenge, the Maven Railway challenge. It’s my first challenge, so I’m going for the first-time entrant price ….. 😊 >> Lees verder
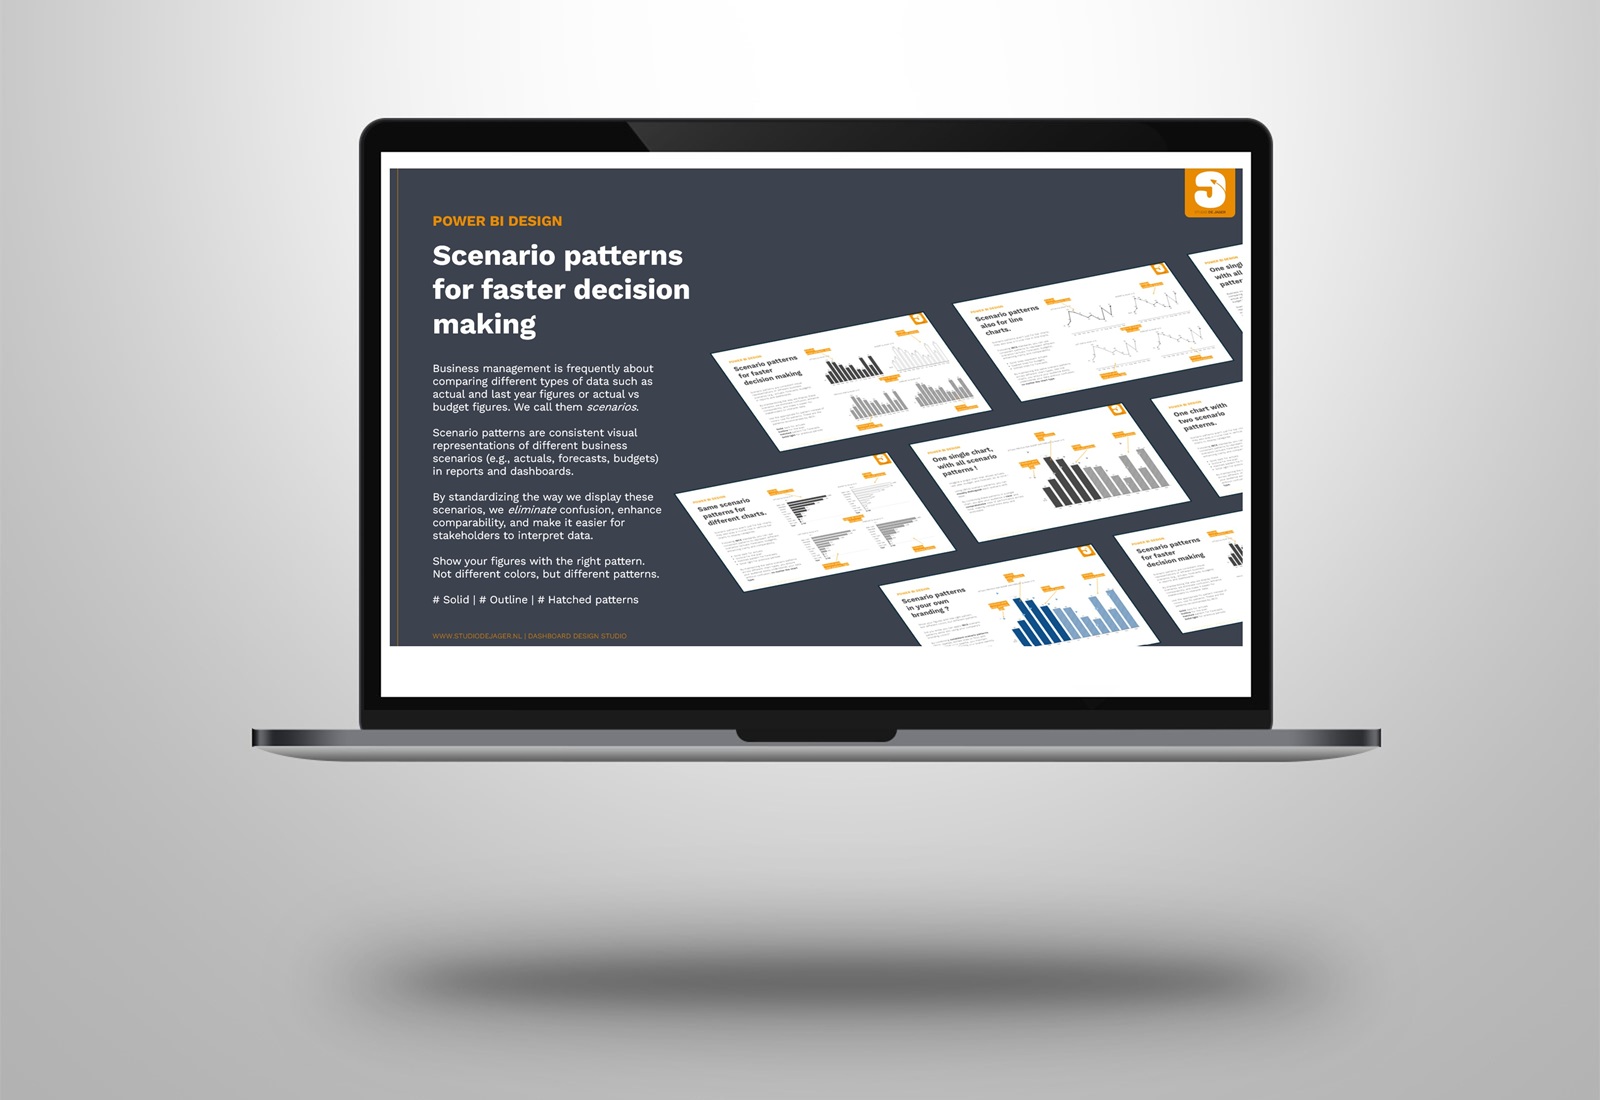
Power BI | scenario patterns in your reports
Sasja Jager, de2025-11-14T14:34:10+01:00𝐀𝐫𝐞 𝐲𝐨𝐮 𝐮𝐬𝐢𝐧𝐠 𝐬𝐜𝐞𝐧𝐚𝐫𝐢𝐨 𝐩𝐚𝐭𝐭𝐞𝐫𝐧𝐬 𝐢𝐧 𝐲𝐨𝐮𝐫 𝐫𝐞𝐩𝐨𝐫𝐭𝐬 ? If not, you might be missing out on a powerful tool to enhance data clarity and communication. In today's data-driven world, 𝐜𝐥𝐞𝐚𝐫 𝐚𝐧𝐝 𝐞𝐟𝐟𝐞𝐜𝐭𝐢𝐯𝐞 communication of business metrics is critical. One powerful tool to achieve this is the 𝐮𝐬𝐞 𝐨𝐟 𝐬𝐜𝐞𝐧𝐚𝐫𝐢𝐨 𝐩𝐚𝐭𝐭𝐞𝐫𝐧𝐬, a key component >> Lees verder
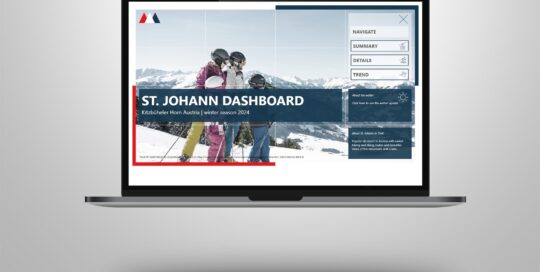
Power BI | St Johann ski dashboard
Sasja Jager, de2025-11-14T13:45:31+01:00I am happy to share with you an exciting new project I've been working on - the St Johann in Tirol Power BI dashboard! Inspired by the recent visit with my family to the St Johann in Tirol ski area in Austria, I've created this website-inspired dashboard that captures the essence of the >> Lees verder