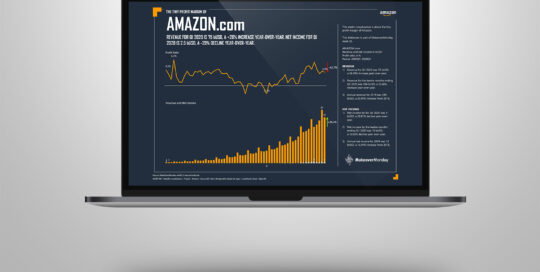
our expertise This week’s visualization is about the tiny profit margin of Amazon.com as part of MakeoverMonday week 25. This week I used the charts of Zebra BI to show the development of the revenue and the profit margin. As a difference to the original Viz I created a separate line chart with >> Lees verder
