Power BI dashboard design | When design meets actionability – “less is more”
Less is more ..... Effective dashboards go beyond aesthetics as they combine 𝐔𝐗 - 𝐔𝐈 𝐝𝐞𝐬𝐢𝐠𝐧 with 𝐚𝐜𝐭𝐢𝐨𝐧𝐚𝐛𝐥𝐞 𝐢𝐧𝐬𝐢𝐠𝐡𝐭𝐬 to drive decisions. So how can you create such dashboards that it is still >> Lees verder
Power BI | Action dots are here – a must have for your dashboards
Effective dashboards go beyond aesthetics as they combine UX/UI design with 𝐚𝐜𝐭𝐢𝐨𝐧𝐚𝐛𝐥𝐞 𝐢𝐧𝐬𝐢𝐠𝐡𝐭𝐬 to drive decisions. Zebra BI latest product update brings an innovative way to 𝐯𝐢𝐬𝐮𝐚𝐥𝐢𝐳𝐞 𝐯𝐚𝐫𝐢𝐚𝐧𝐜𝐞𝐬 with Action dots. Action dots transform >> Lees verder
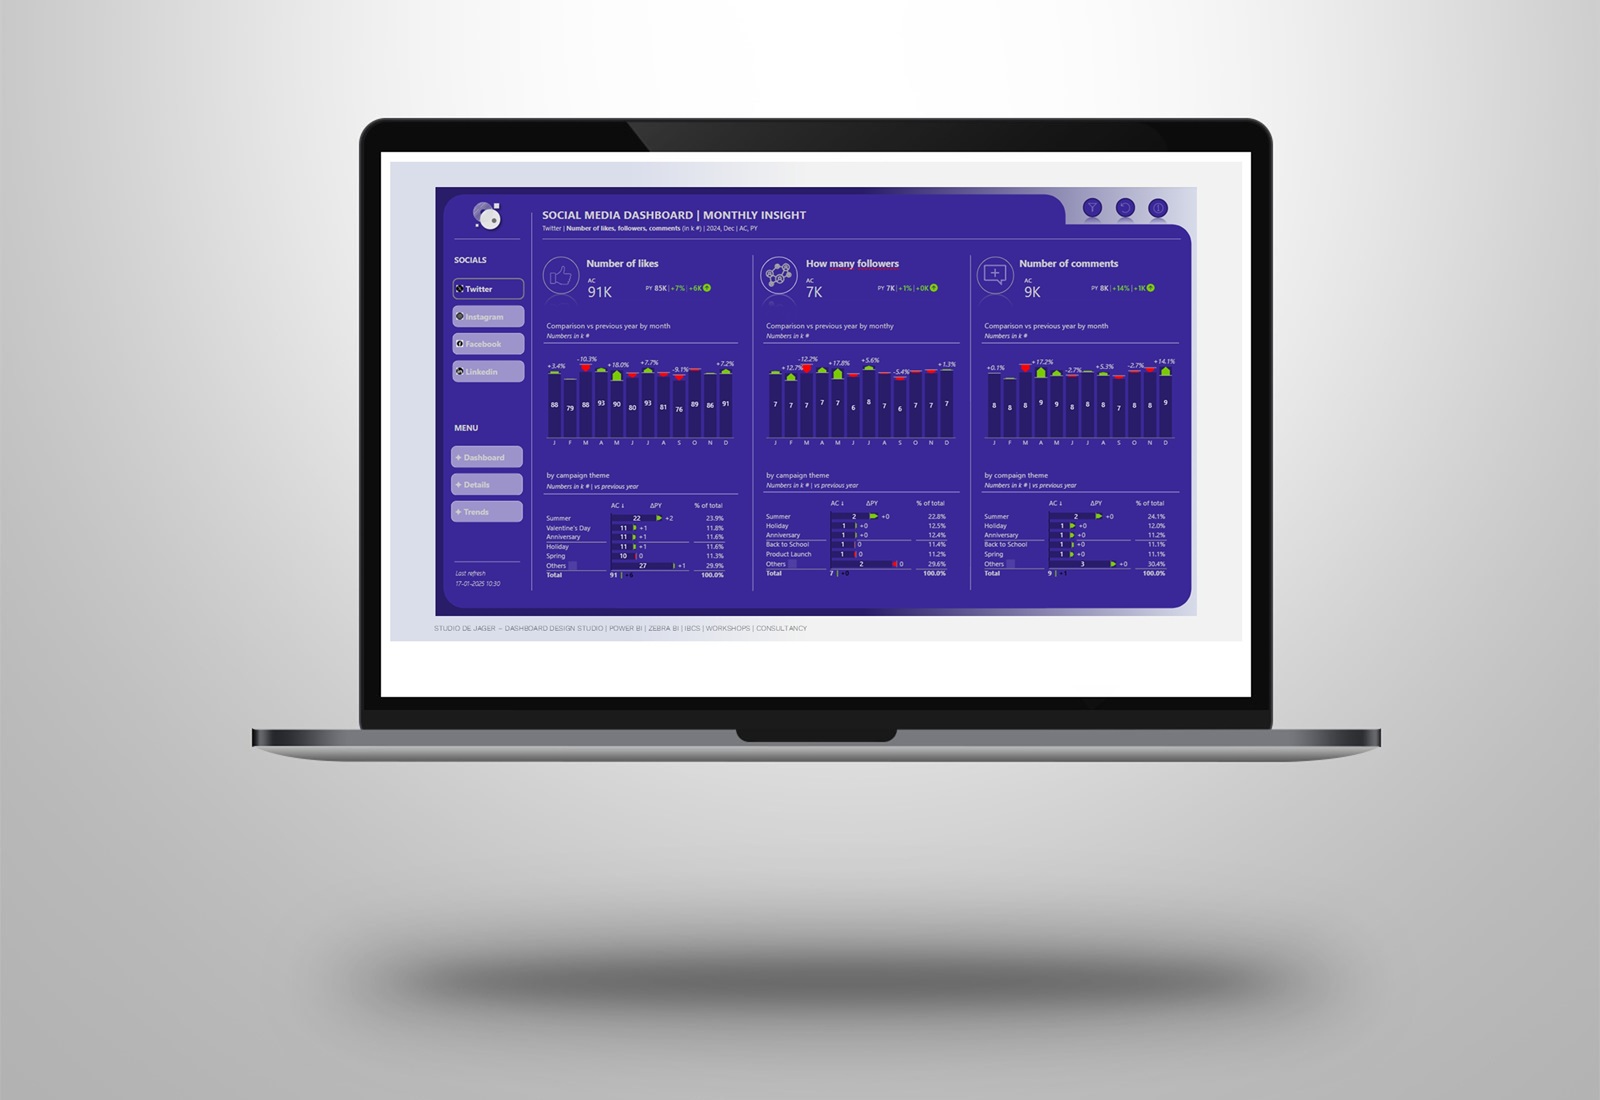
Power BI dashboard design | When – dark theme – design meets actionability
The motto "𝙈𝙖𝙠𝙚 𝙮𝙤𝙪𝙧 𝙋𝙤𝙬𝙚𝙧 𝘽𝙄 𝙧𝙚𝙥𝙤𝙧𝙩𝙨 𝙣𝙤𝙩 𝙡𝙤𝙤𝙠 𝙡𝙞𝙠𝙚 𝙋𝙤𝙬𝙚𝙧 𝘽𝙄!" as Nicholas Lea-Trengrouse stated is something I really like. Follow Nicholas because he creates amazing dashboard examples. Effective dashboards go beyond >> Lees verder
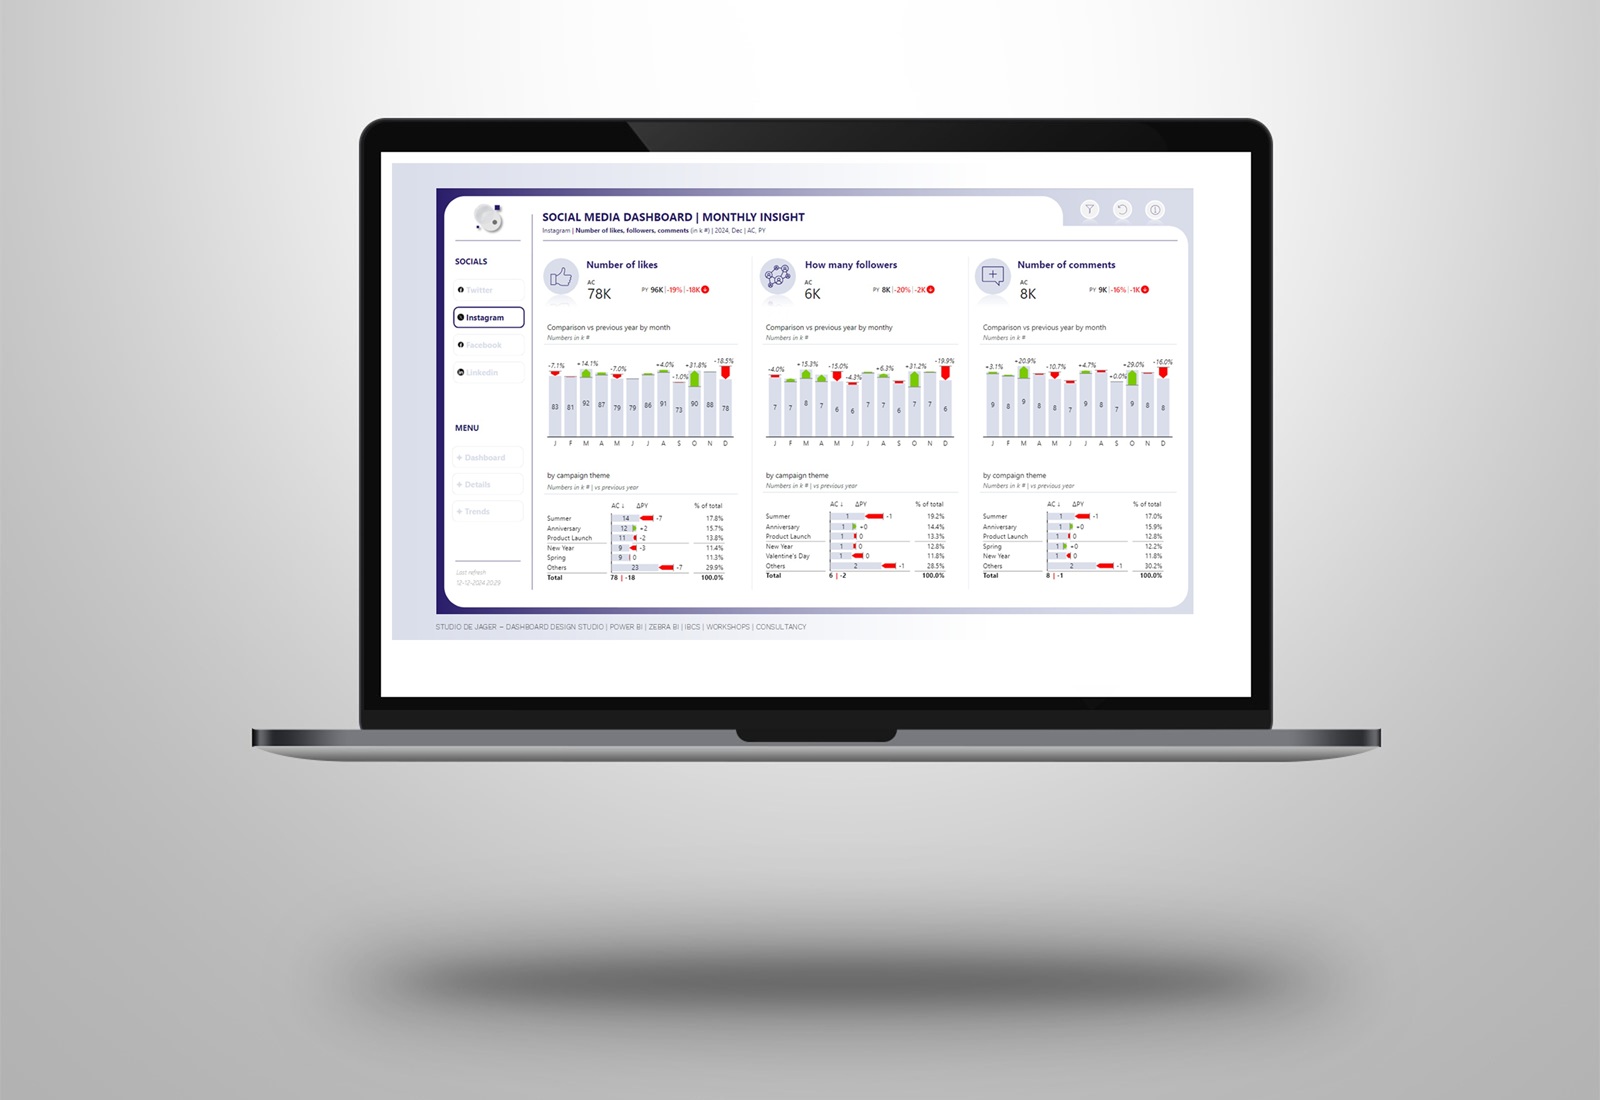
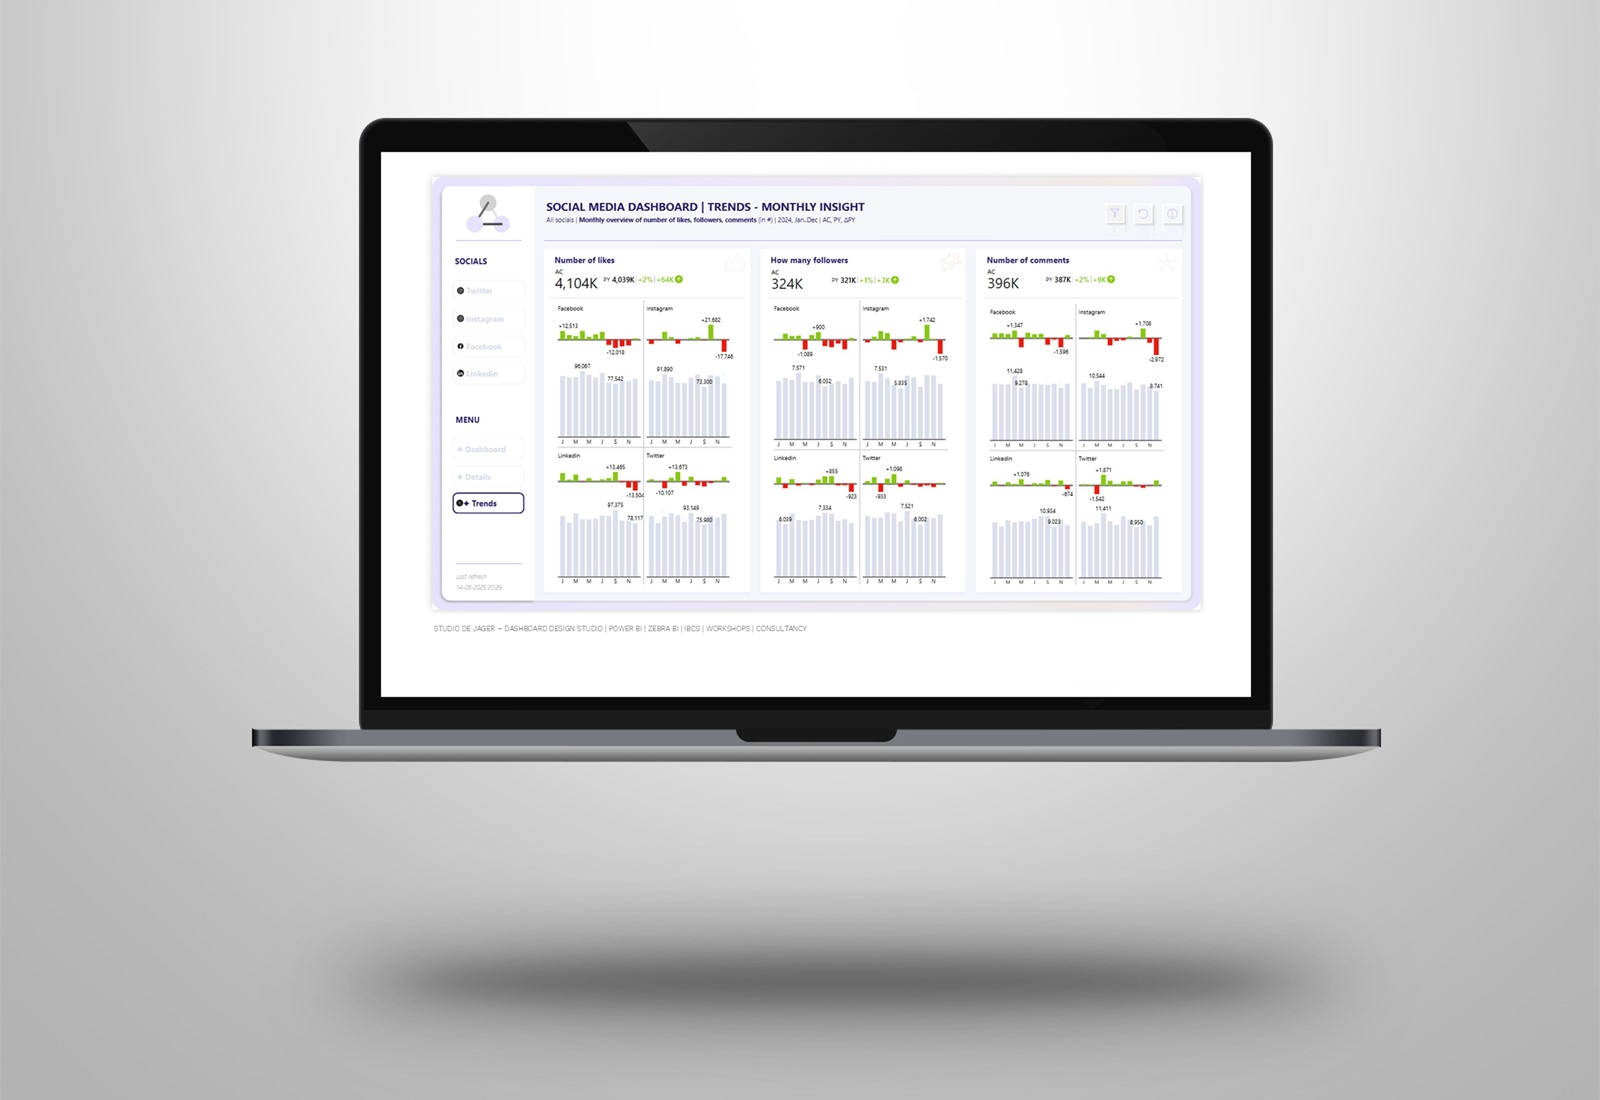
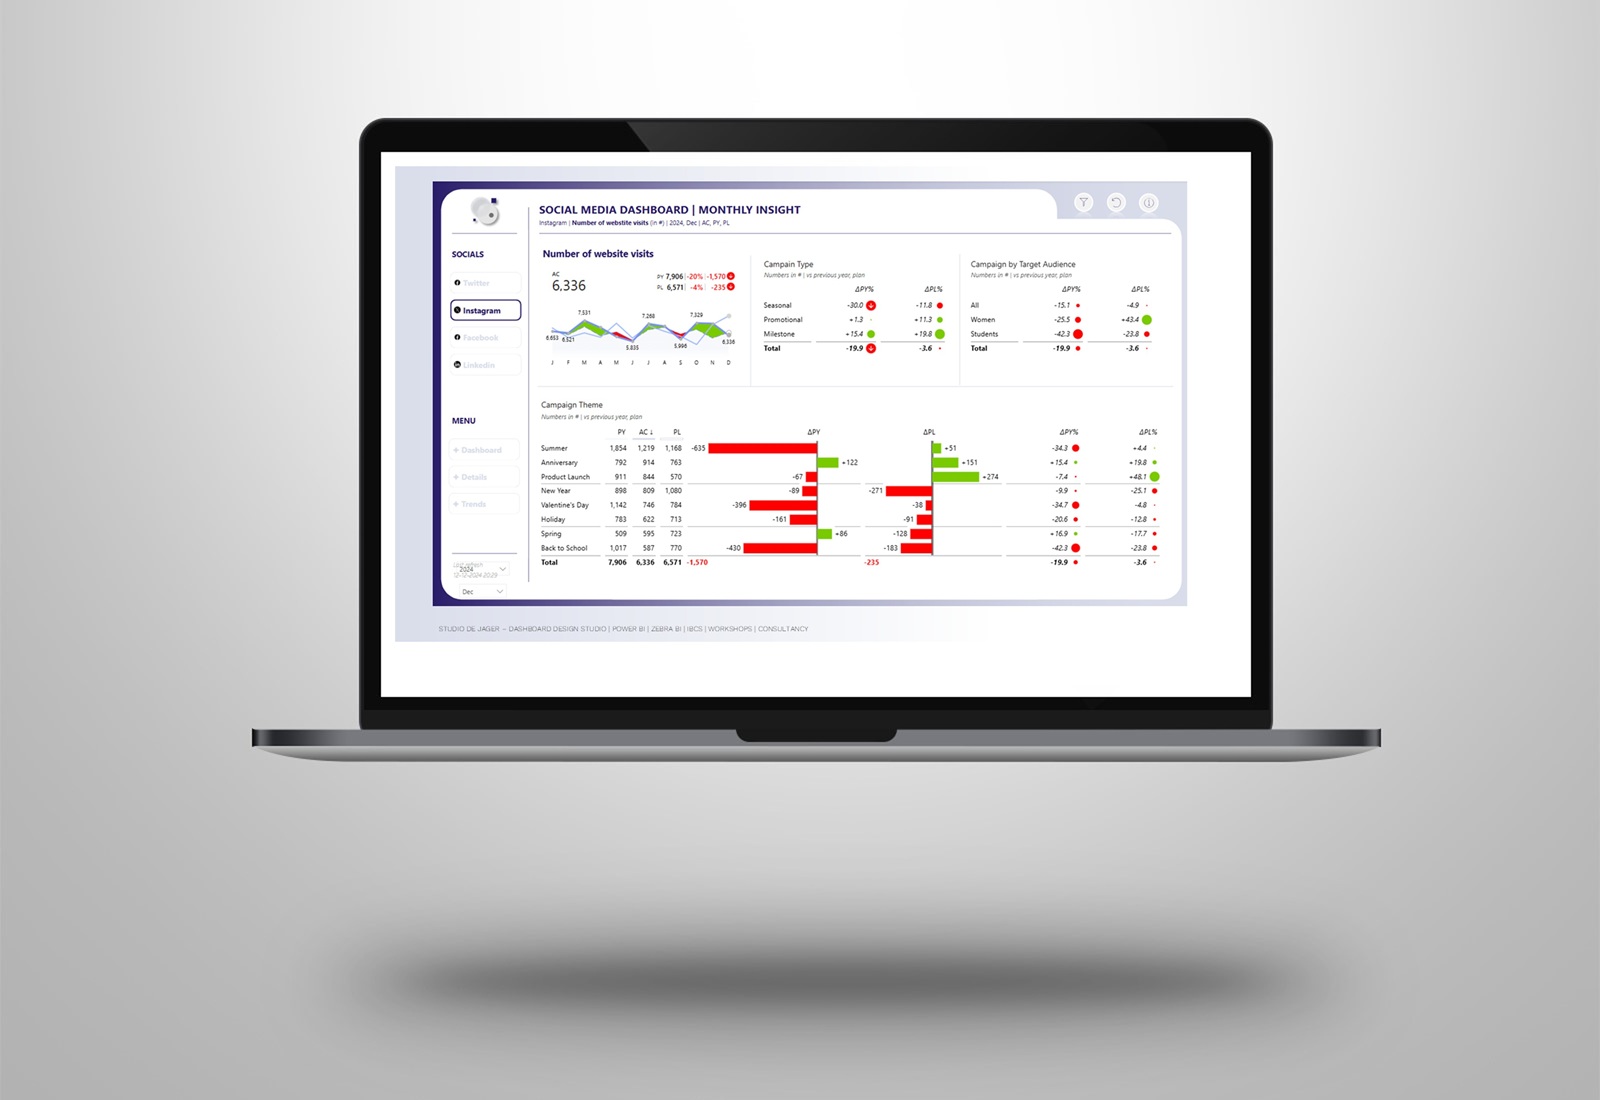
Power BI dashboard design | When design meets actionability
The motto "𝙈𝙖𝙠𝙚 𝙮𝙤𝙪𝙧 𝙋𝙤𝙬𝙚𝙧 𝘽𝙄 𝙧𝙚𝙥𝙤𝙧𝙩𝙨 𝙣𝙤𝙩 𝙡𝙤𝙤𝙠 𝙡𝙞𝙠𝙚 𝙋𝙤𝙬𝙚𝙧 𝘽𝙄!" as Nicholas Lea-Trengrouse stated is something I really like. Follow Nicholas because he creates amazing dashboard examples. Effective dashboards go beyond >> Lees verder
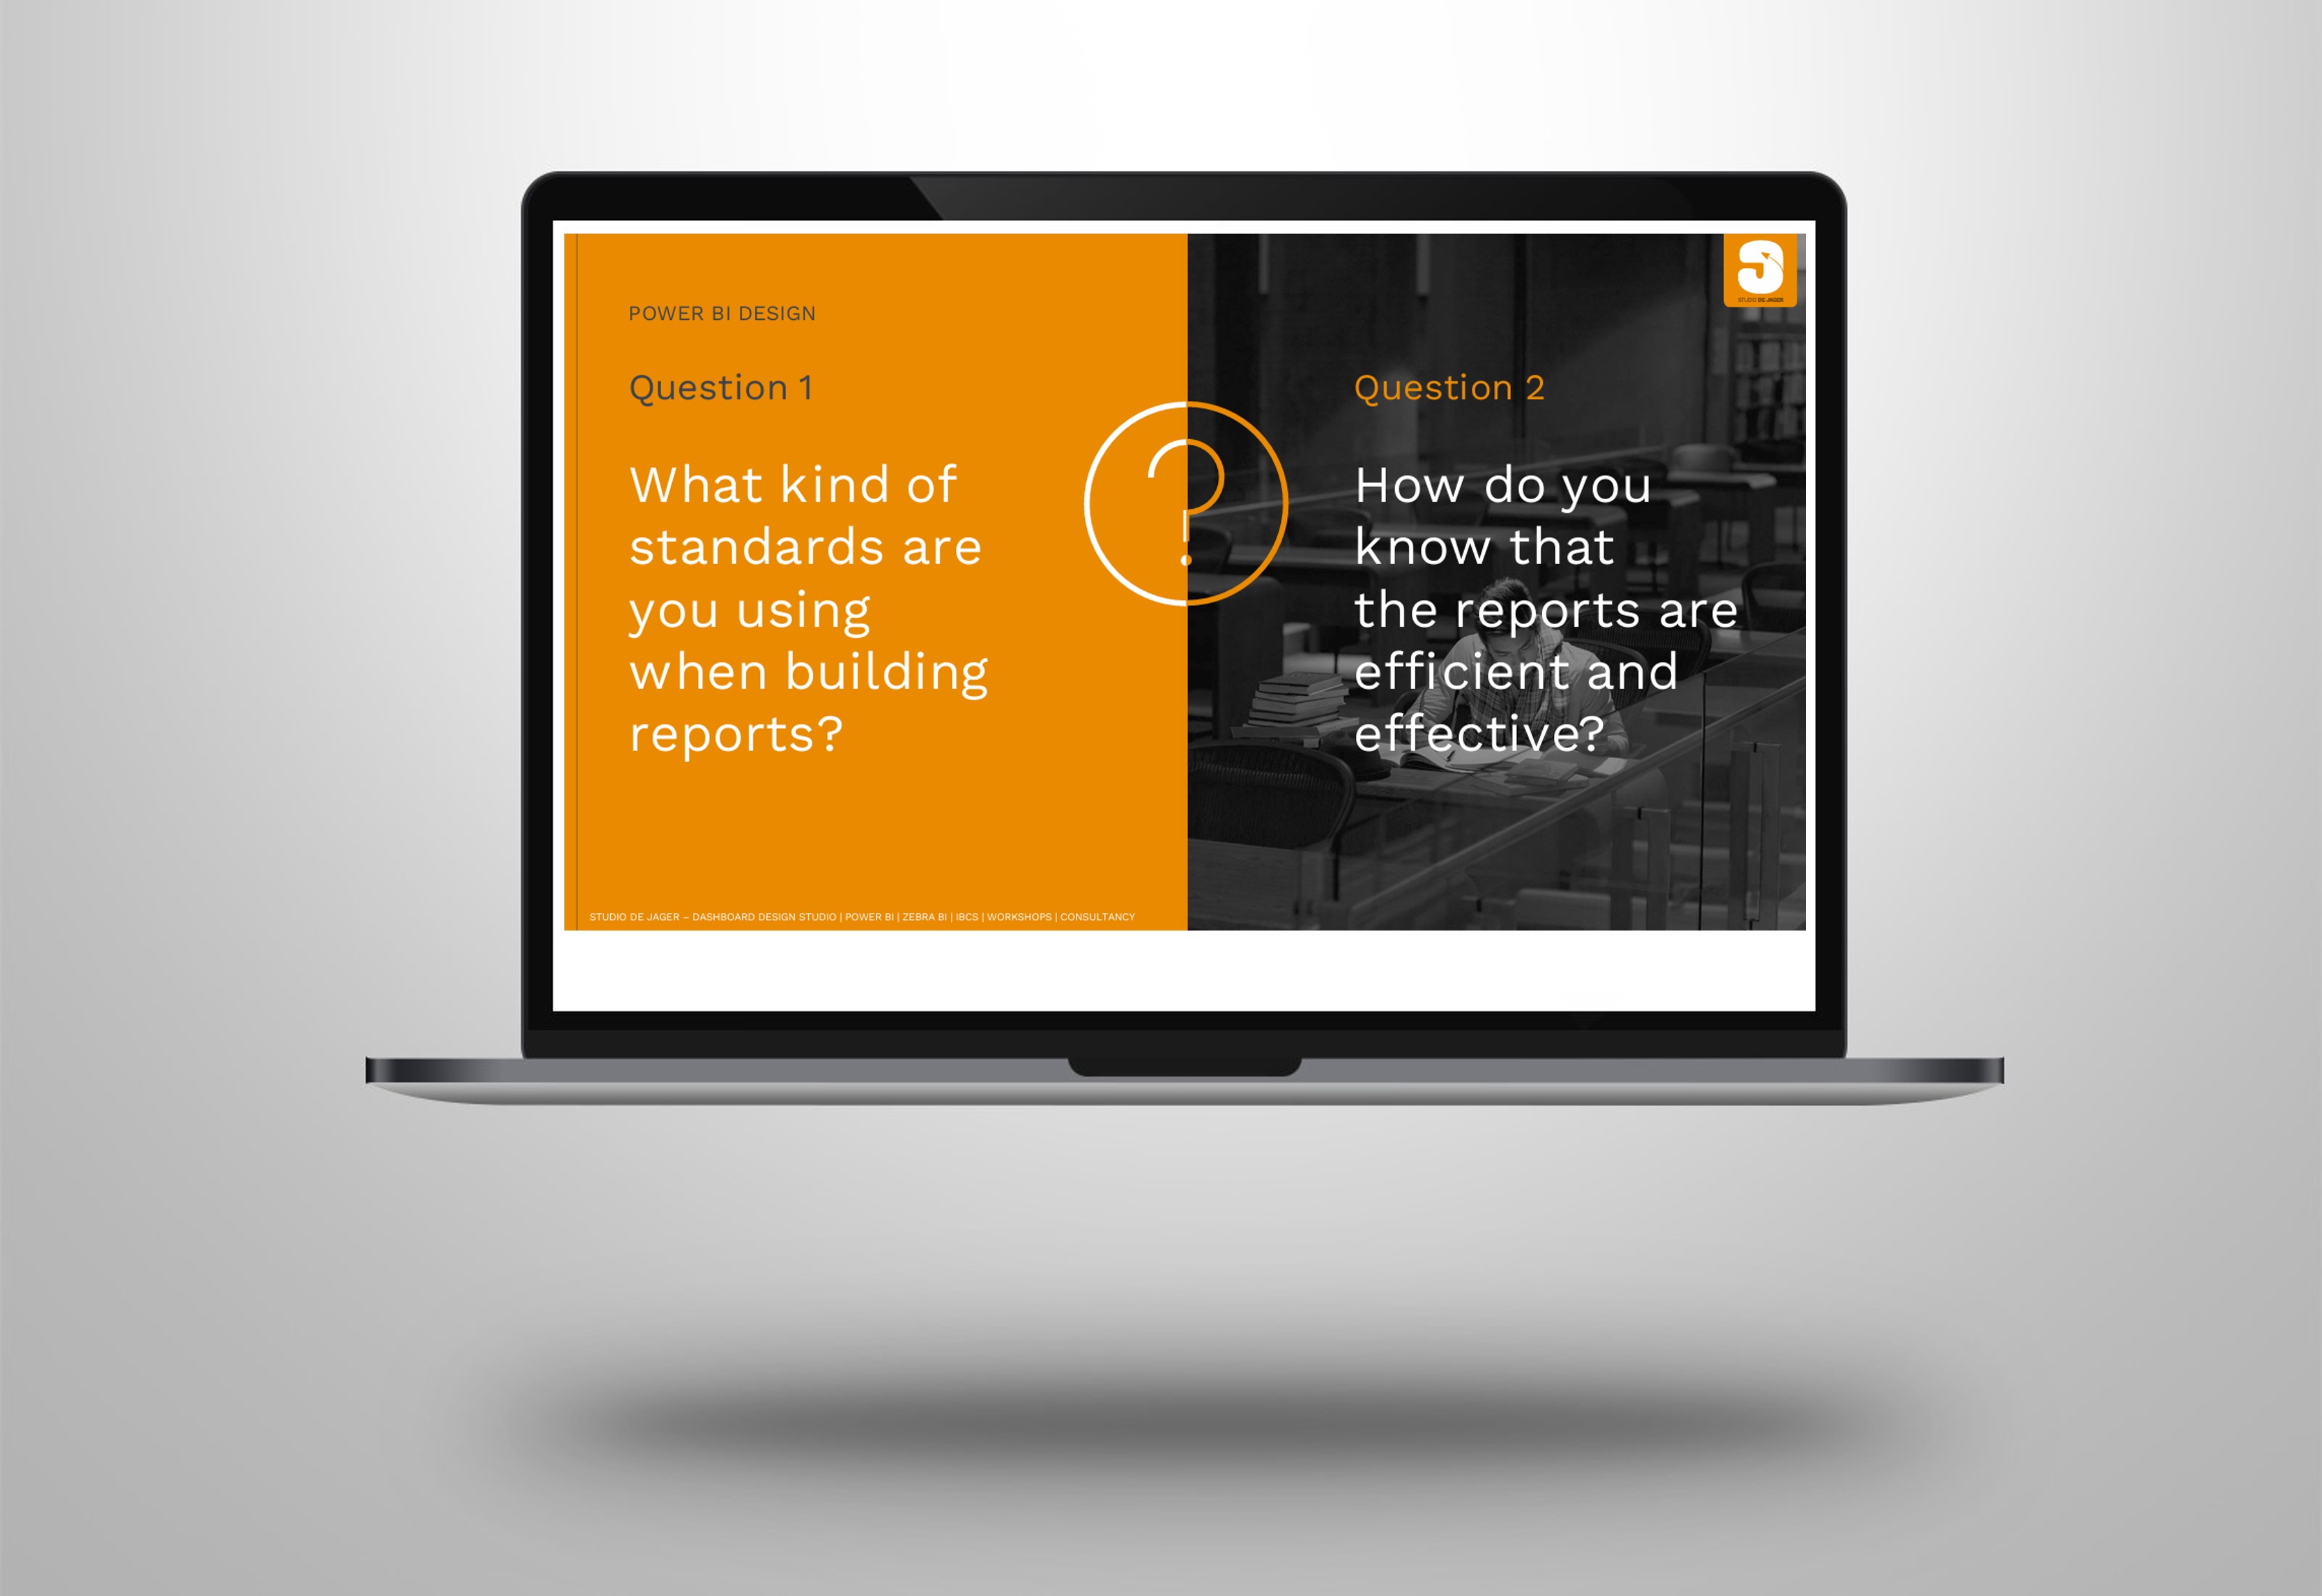
Power BI | Improve the quality and effectiveness for your Power reports
I𝐦𝐩𝐫𝐨𝐯𝐞 𝐭𝐡𝐞 𝐪𝐮𝐚𝐥𝐢𝐭𝐲 𝐚𝐧𝐝 𝐞𝐟𝐟𝐞𝐜𝐭𝐢𝐯𝐞𝐧𝐞𝐬𝐬 𝐨𝐟 𝐲𝐨𝐮𝐫 Power BI 𝐫𝐞𝐩𝐨𝐫𝐭𝐬 📌 𝐐𝐮𝐞𝐬𝐭𝐢𝐨𝐧 1: What kind of 𝐬𝐭𝐚𝐧𝐝𝐚𝐫𝐝𝐬 are you using when building reports? 📌 𝐐𝐮𝐞𝐬𝐭𝐢𝐨𝐧 2: How do you know that the reports you are making >> Lees verder
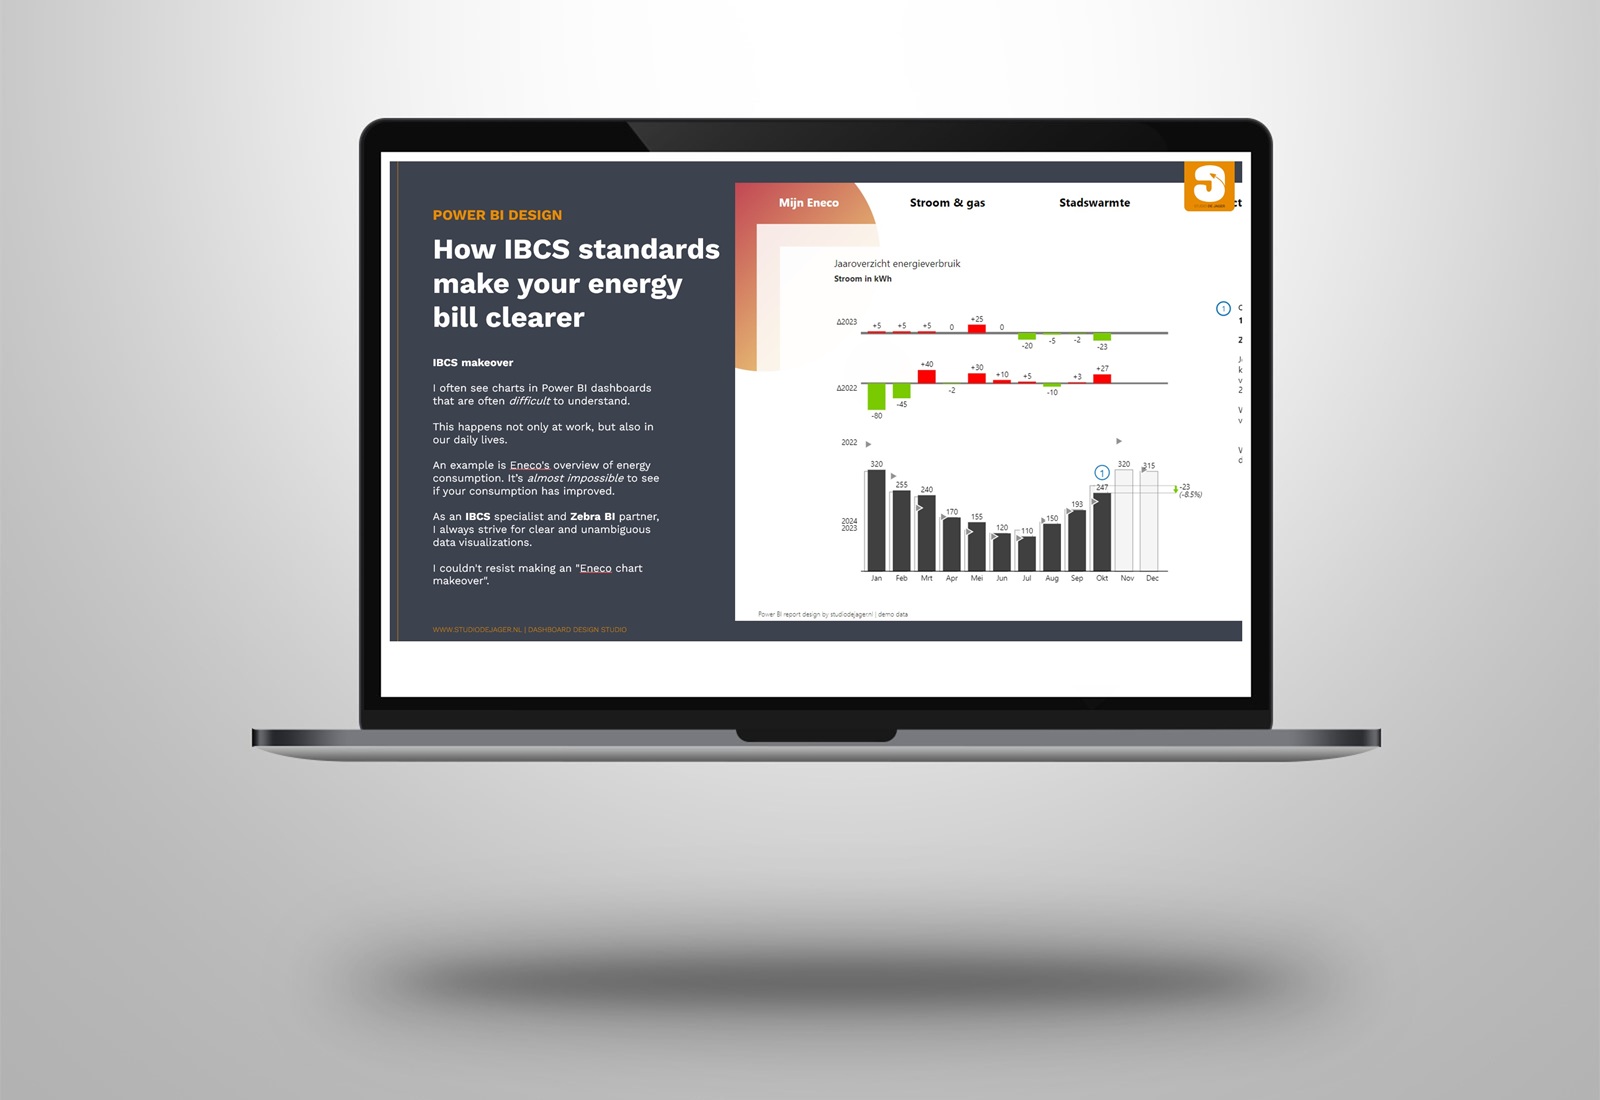
Power BI | How IBCS standards make yor energy bill clearer
I often see graphs in dashboards that are 𝐨𝐟𝐭𝐞𝐧 𝐝𝐢𝐟𝐟𝐢𝐜𝐮𝐥𝐭 𝐭𝐨 𝐮𝐧𝐝𝐞𝐫𝐬𝐭𝐚𝐧𝐝. This happens not only at work, but also in our daily lives. Last week I received the monthly overview from Eneco >> Lees verder
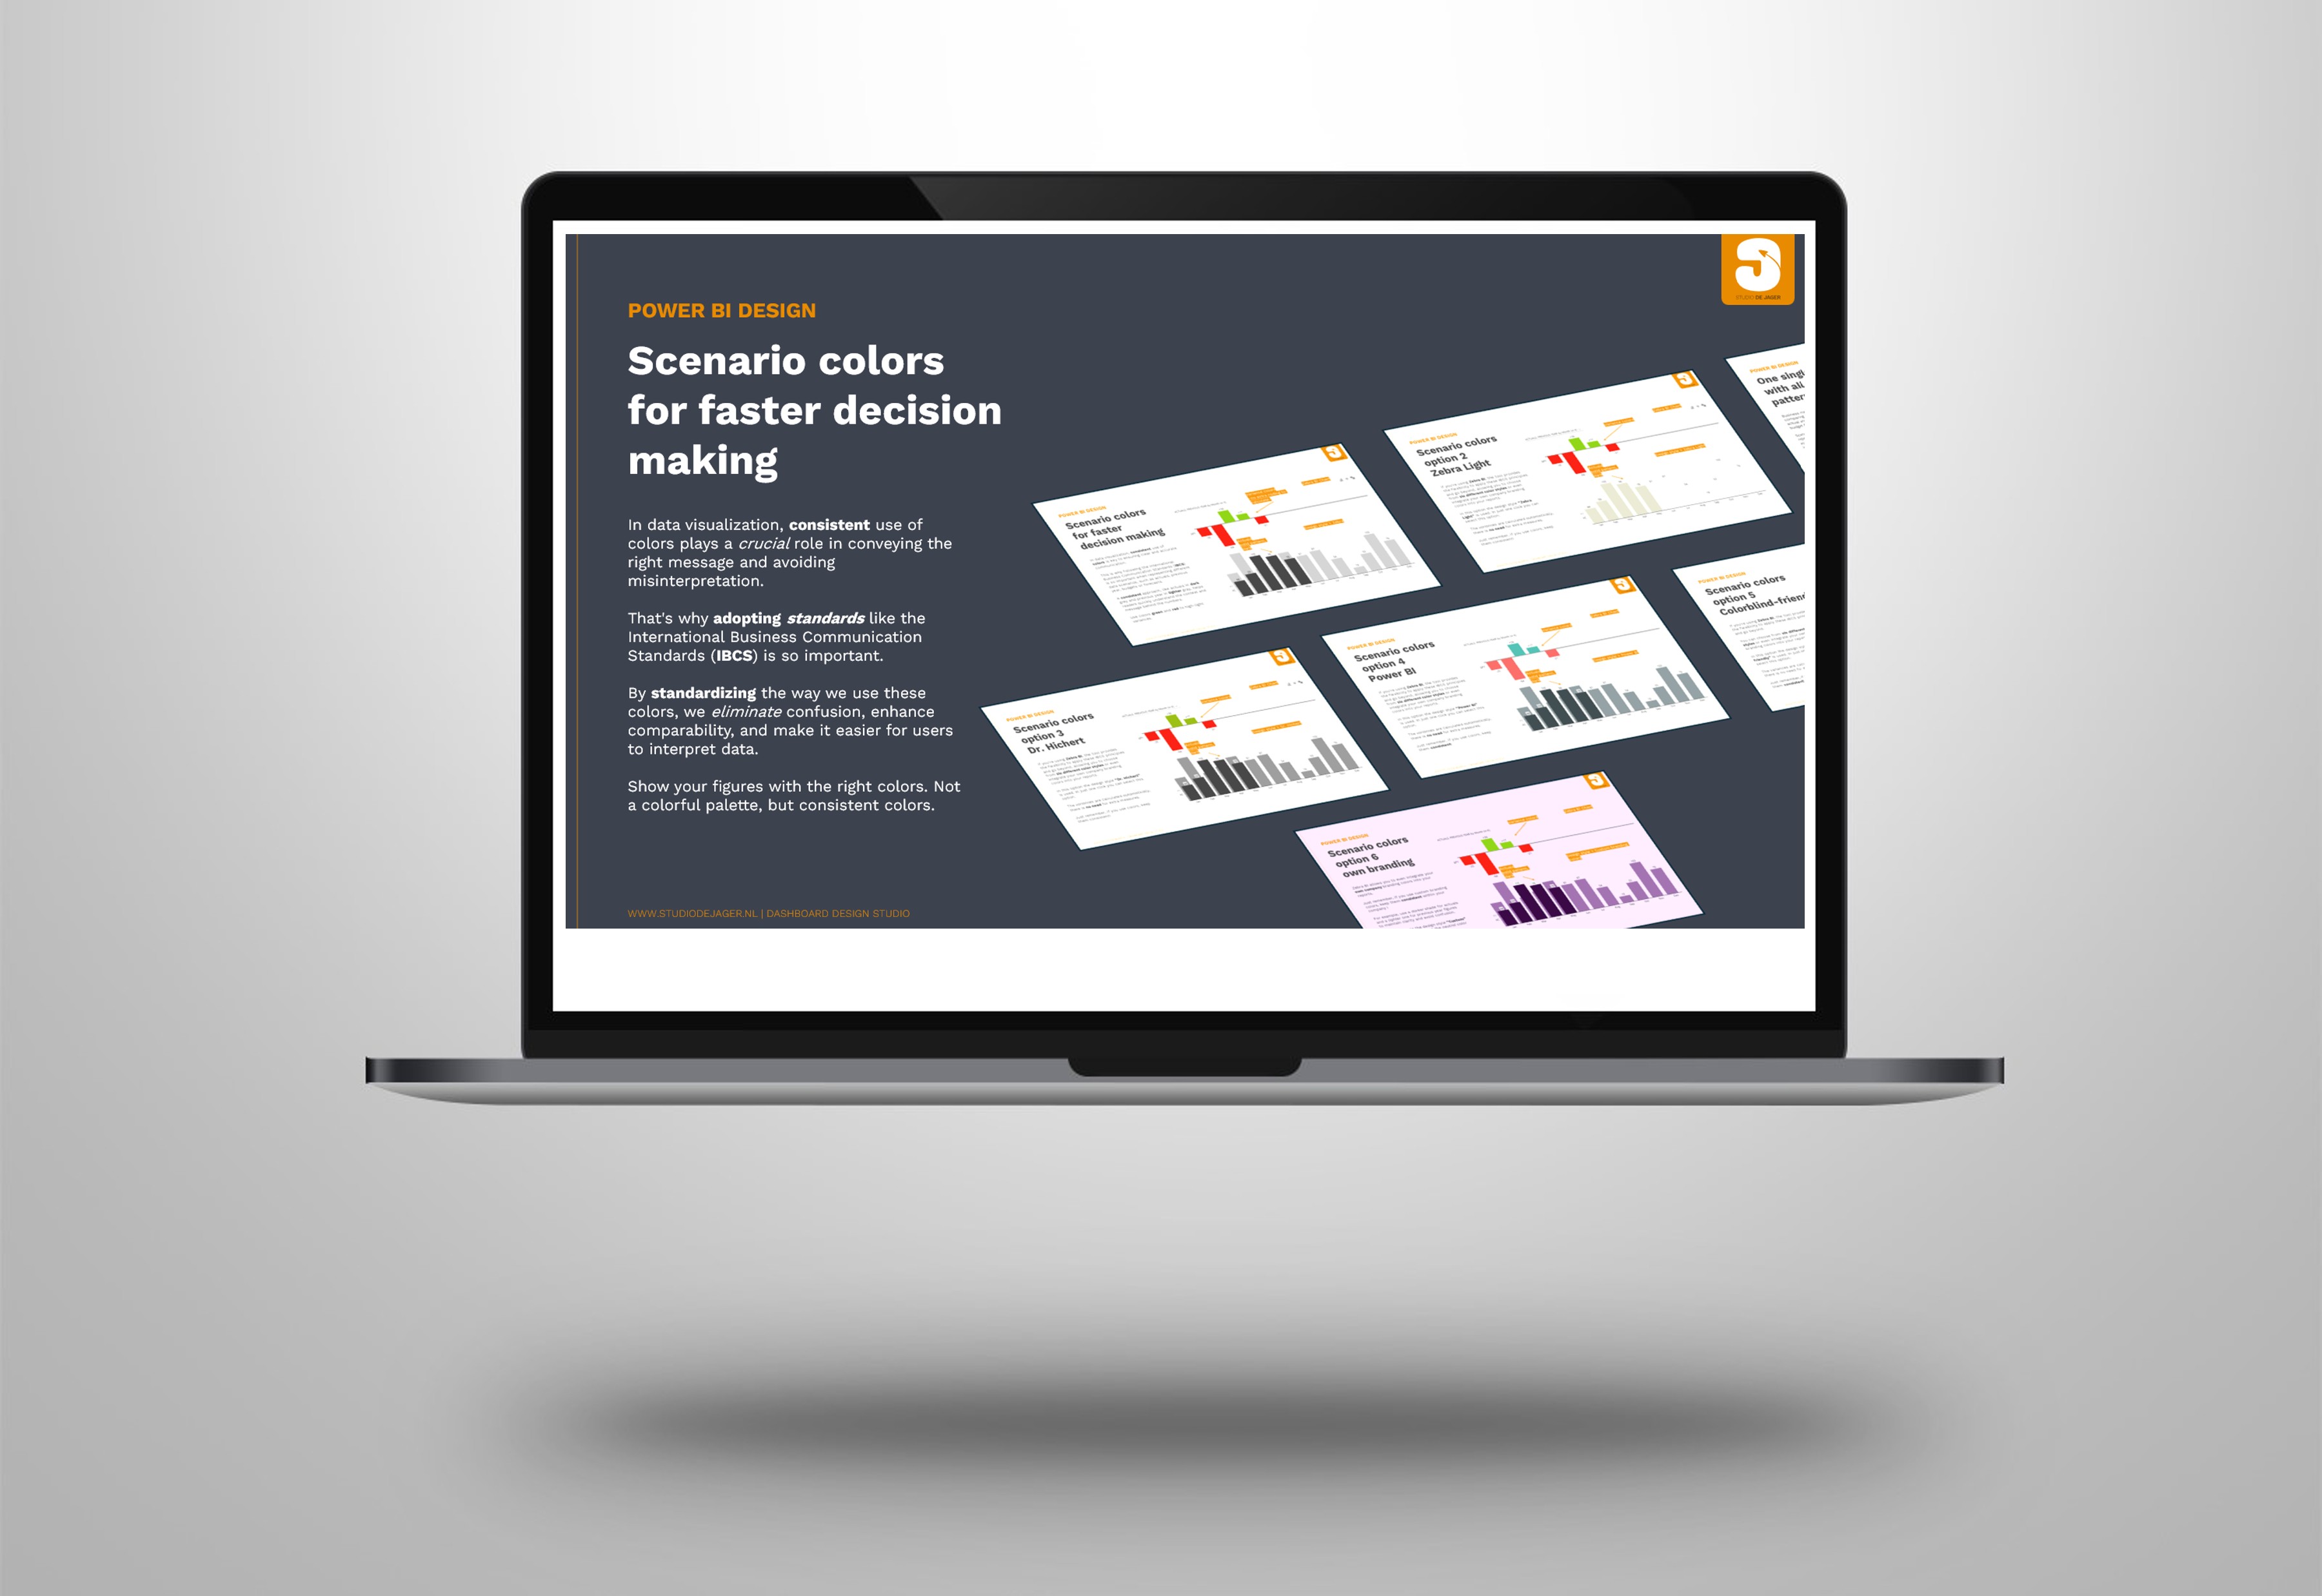
Power BI | The power of scenario colors
In data visualization, 𝐜𝐨𝐧𝐬𝐢𝐬𝐭𝐞𝐧𝐭 𝐮𝐬𝐞 𝐨𝐟 𝐜𝐨𝐥𝐨𝐫𝐬 is key to ensuring clear and accurate communication. This is why following the IBCS – International Business Communication Standards is so important when representing different data >> Lees verder
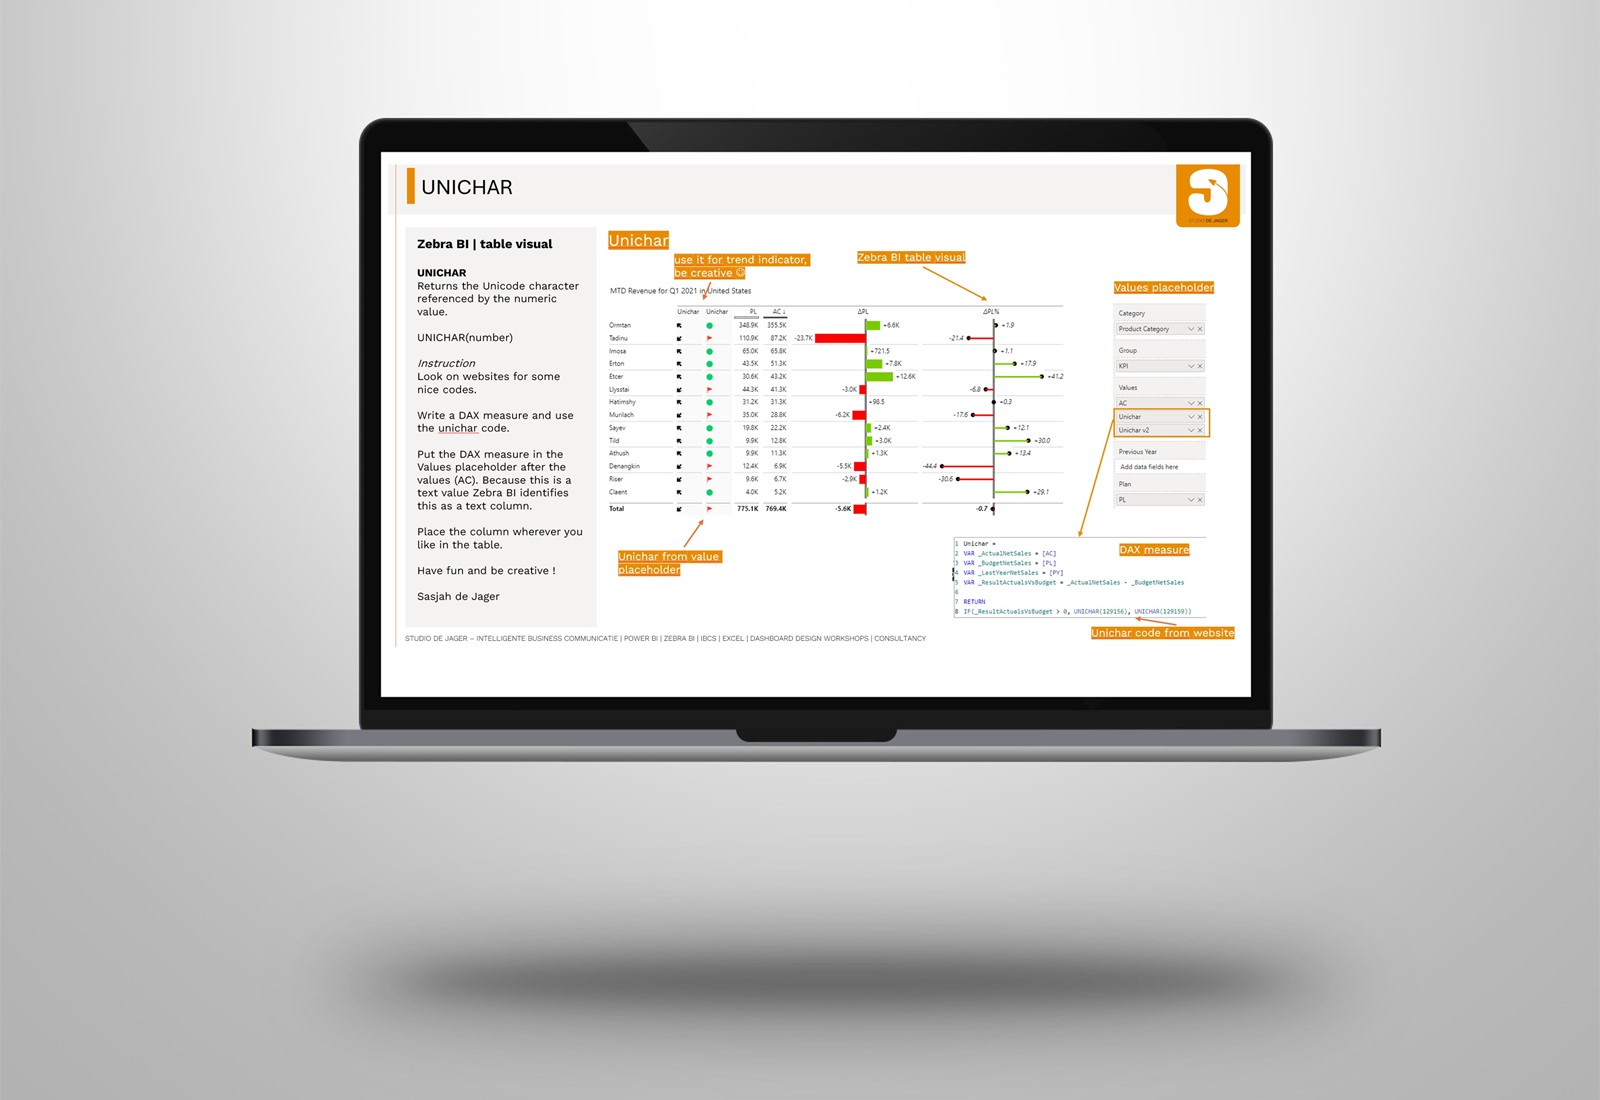
Power BI | Zebra BI table with unichar, Unicode & emoji’s
Attention to design is important in Power BI reports. I'm always looking for the opportunity to add something extra to a report. Let’s share a couple of ideas for Zebra BI users. Having >> Lees verder
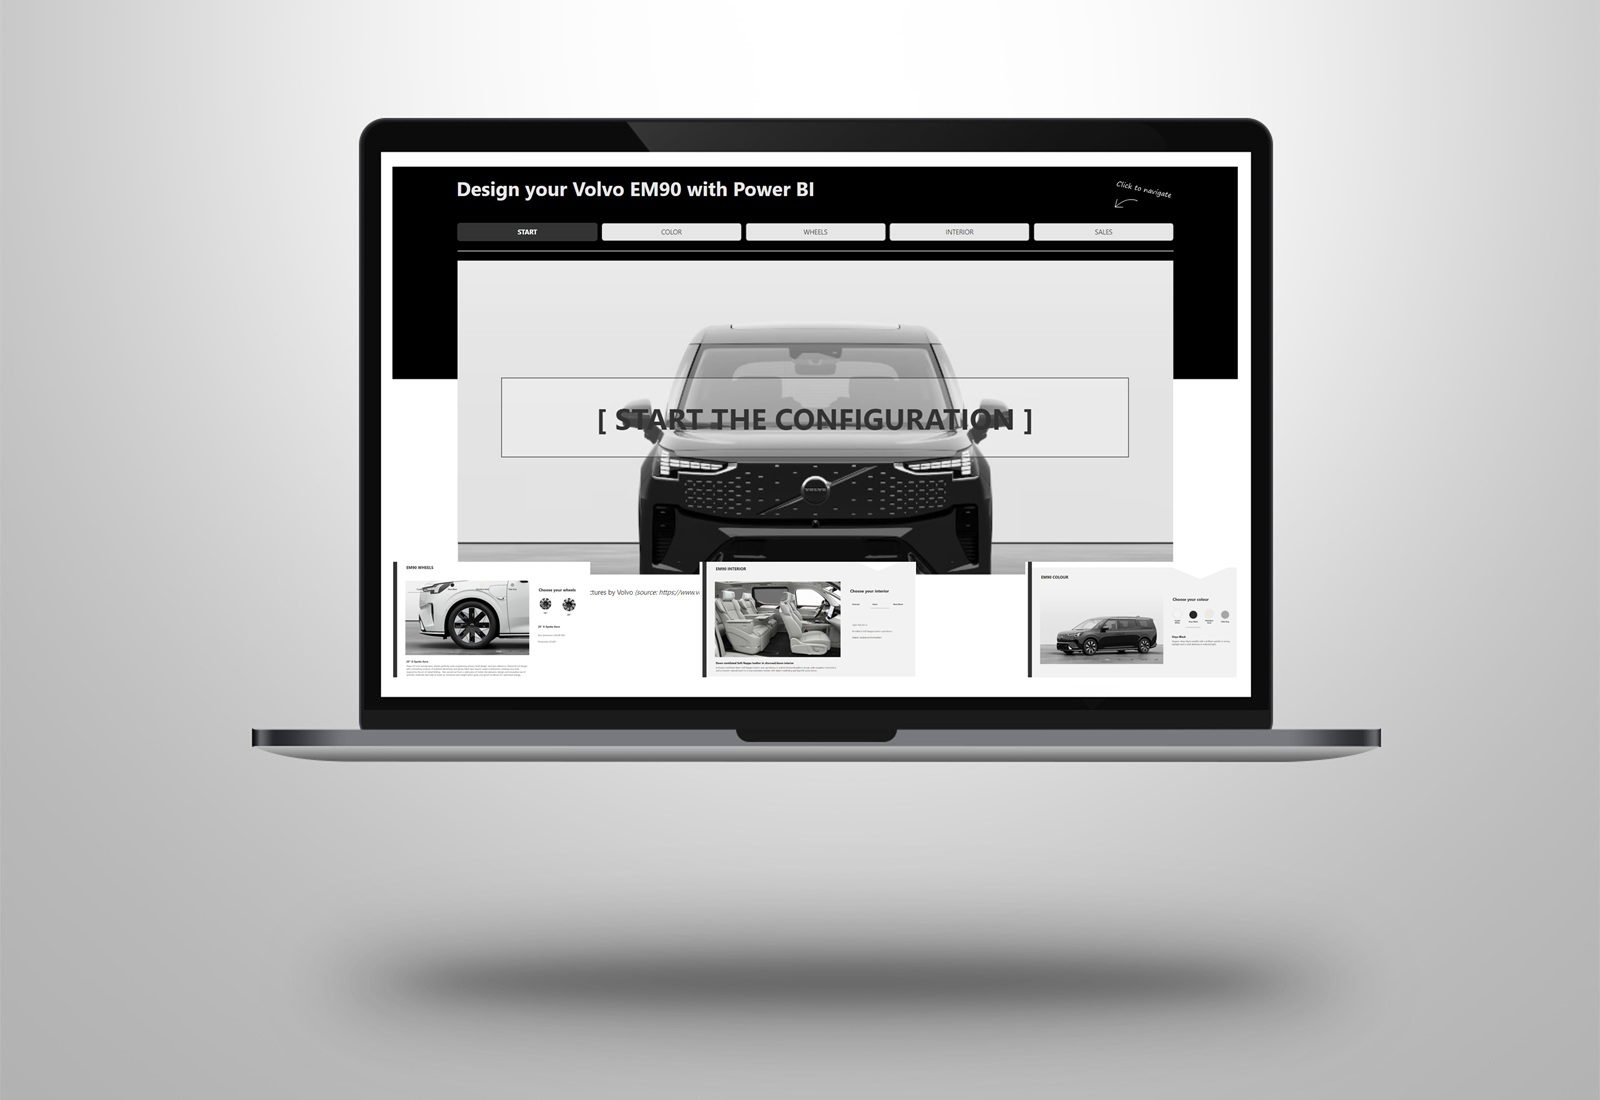
Power BI | Car configurator – design your volvo EM90
I recently challenged myself to create a car configurator for the 𝐕𝐨𝐥𝐯𝐨 𝐄𝐌90 using hashtag#PowerBI and combining both the data-driven power of BI tools with 𝘮𝘺 𝘱𝘢𝘴𝘴𝘪𝘰𝘯 𝘧𝘰𝘳 𝘥𝘦𝘴𝘪𝘨𝘯 𝘢𝘯𝘥 𝘤𝘳𝘦𝘢𝘵𝘪𝘷𝘪𝘵𝘺. The Volvo >> Lees verder
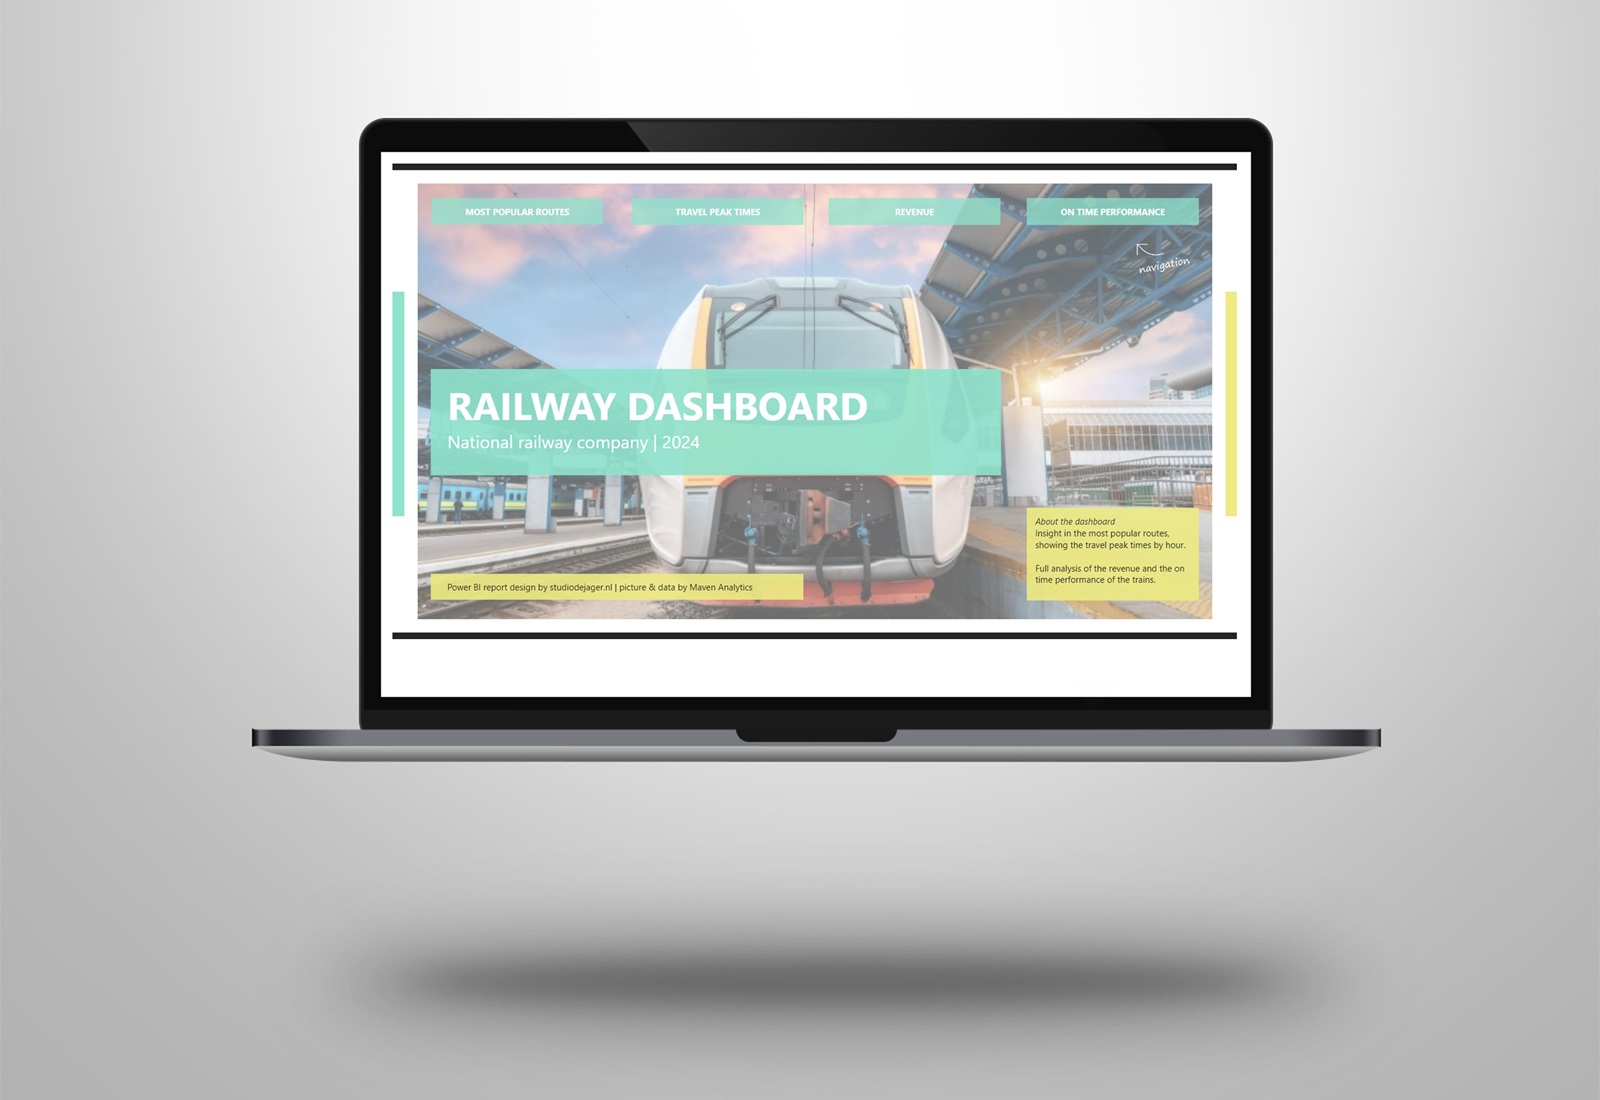
Power BI | Participating in Maven Railway Challenge
Last Maven Analytics challenge I had some problems with uploading my entry on time and unfortunately I couldn't participate. This time (Branislav Poljašević) I'm on time and I want to participate in the >> Lees verder