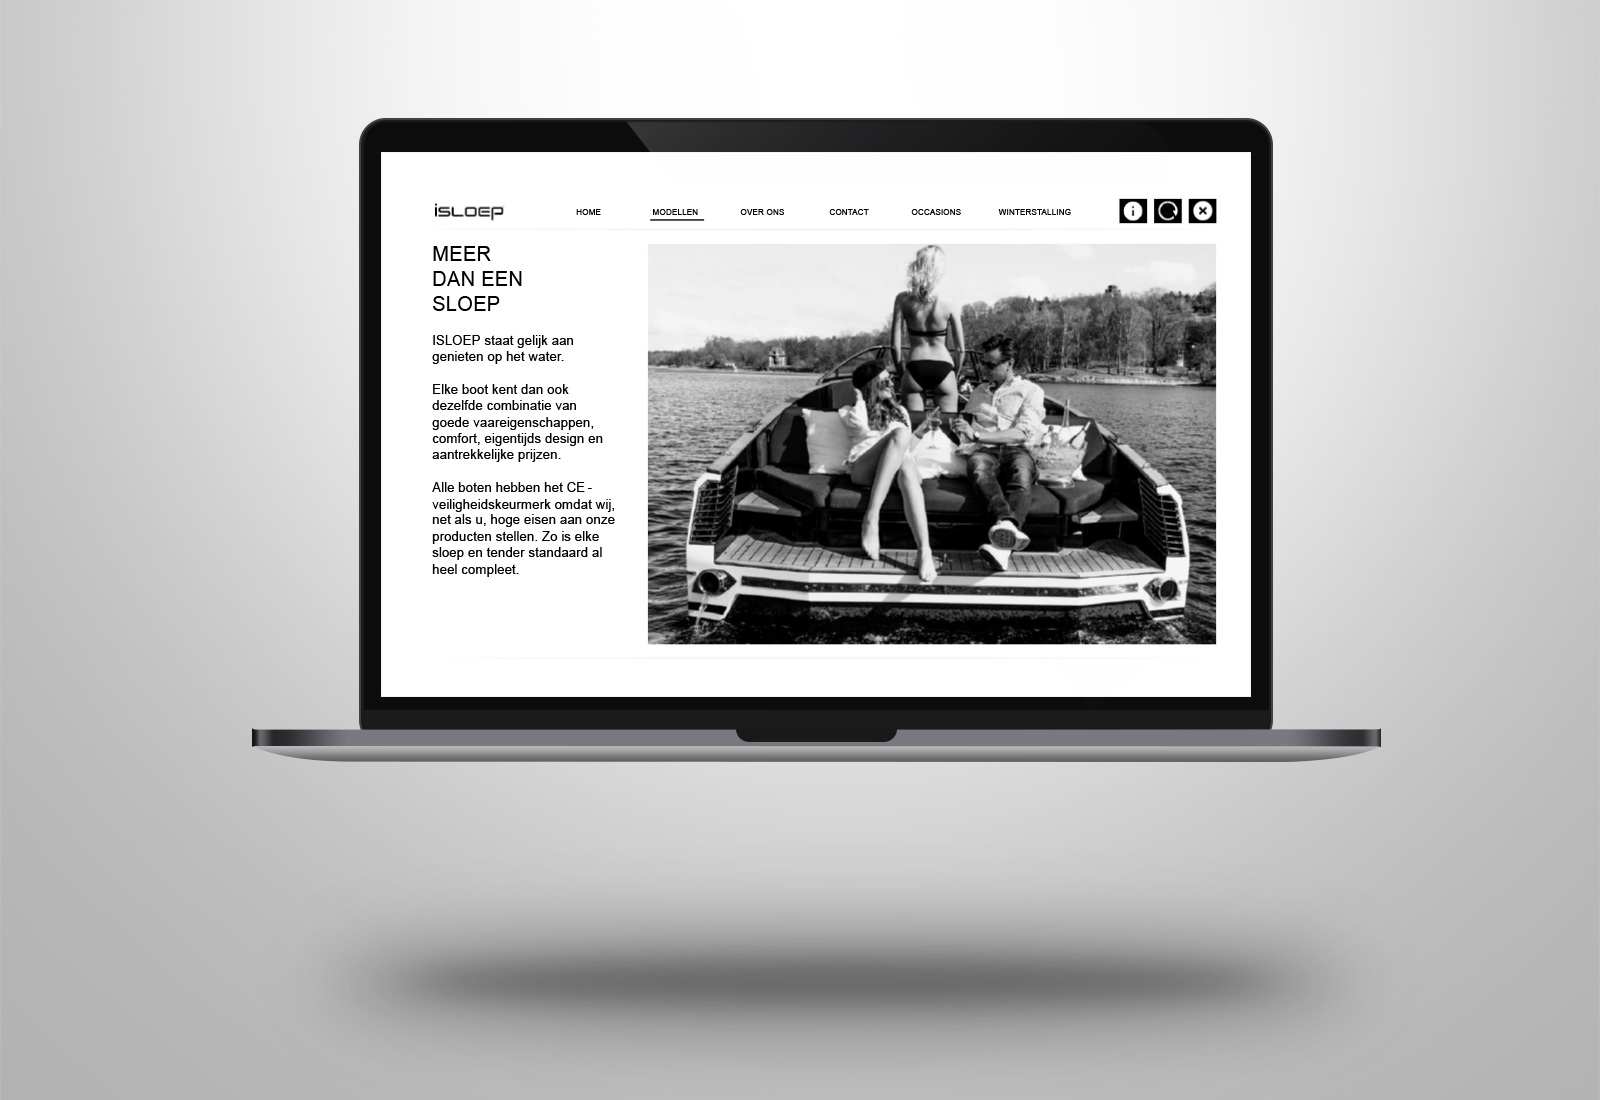
our expertise During the summer period I’d like to spent a lot of time on my boat with my family and friends. We always have fun and sailing with the boot gives a lot of relaxation. My personal favorite, the isloep 735 ! Recently Zebra BI released the last update before the summer >> Lees verder
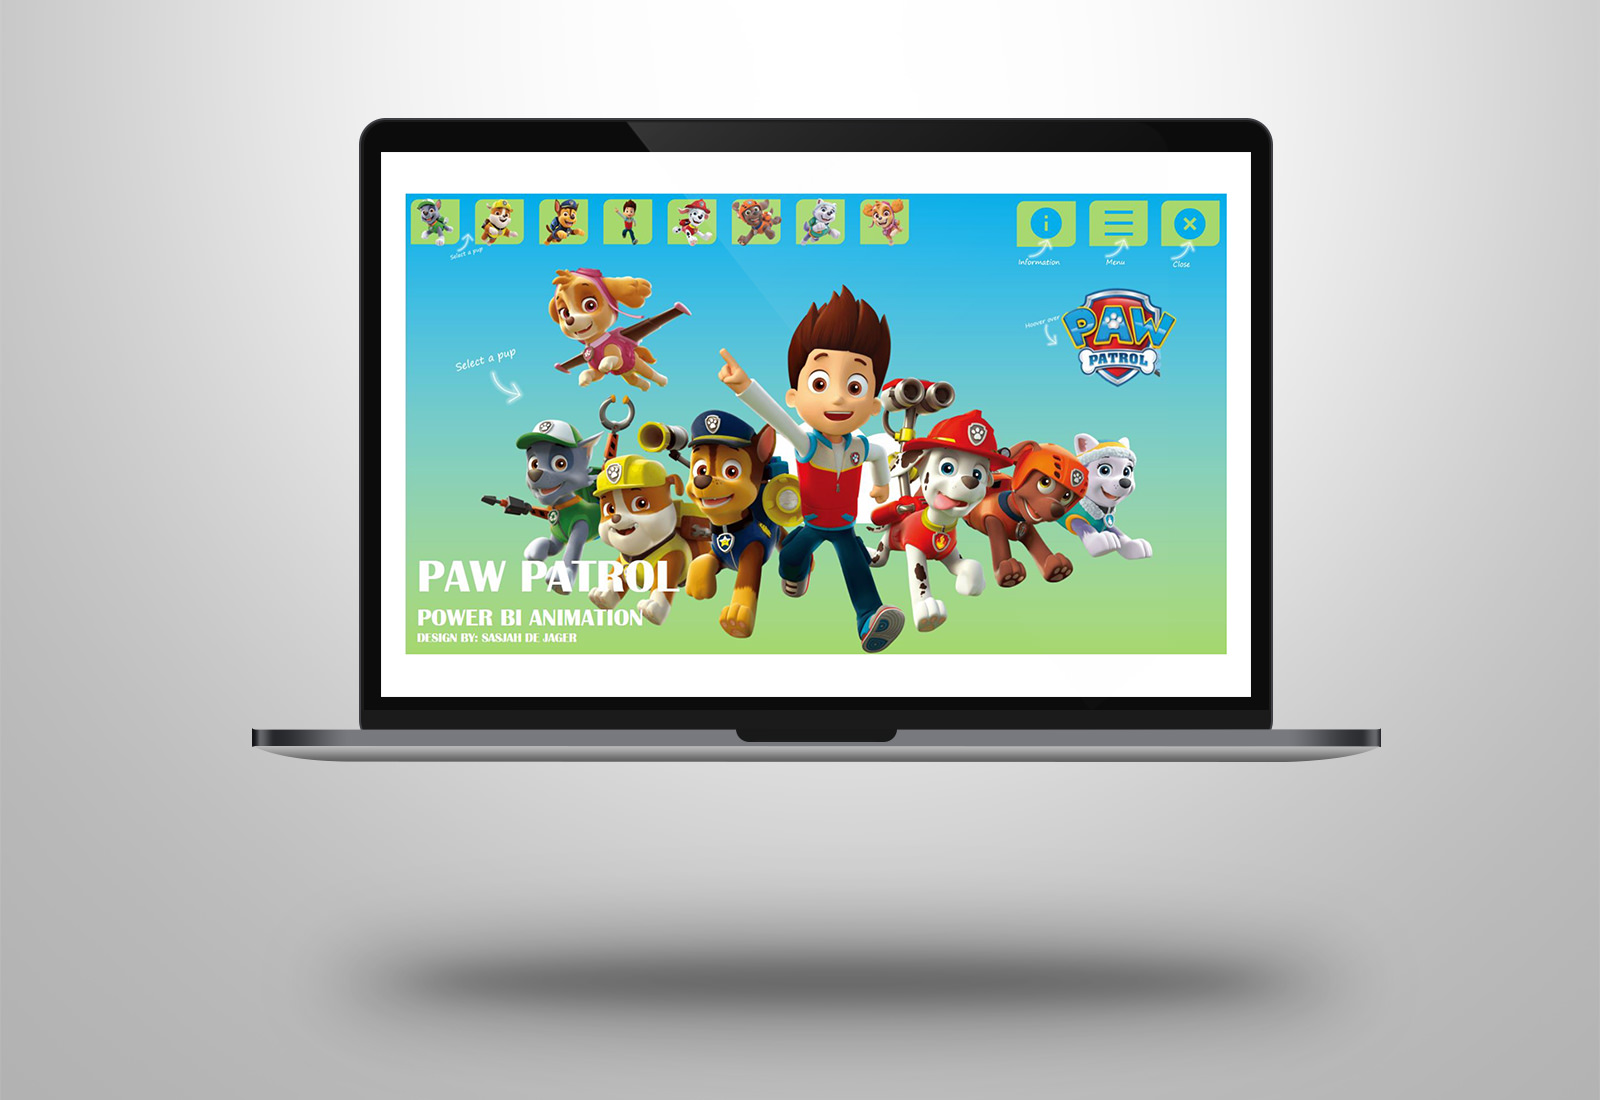
Power BI | Paw Patrol dashboard animation
kaboem2021-06-29T14:42:13+02:00our expertise This week something totally different, no business report in Power BI. Inspired by earlier work of Armand van Amersfoort (Horse Power BI) I decided to make an animation in Microsoft Power BI. I asked my little daughter Evy (5 years old) for the subject. She is a very big fan of >> Lees verder

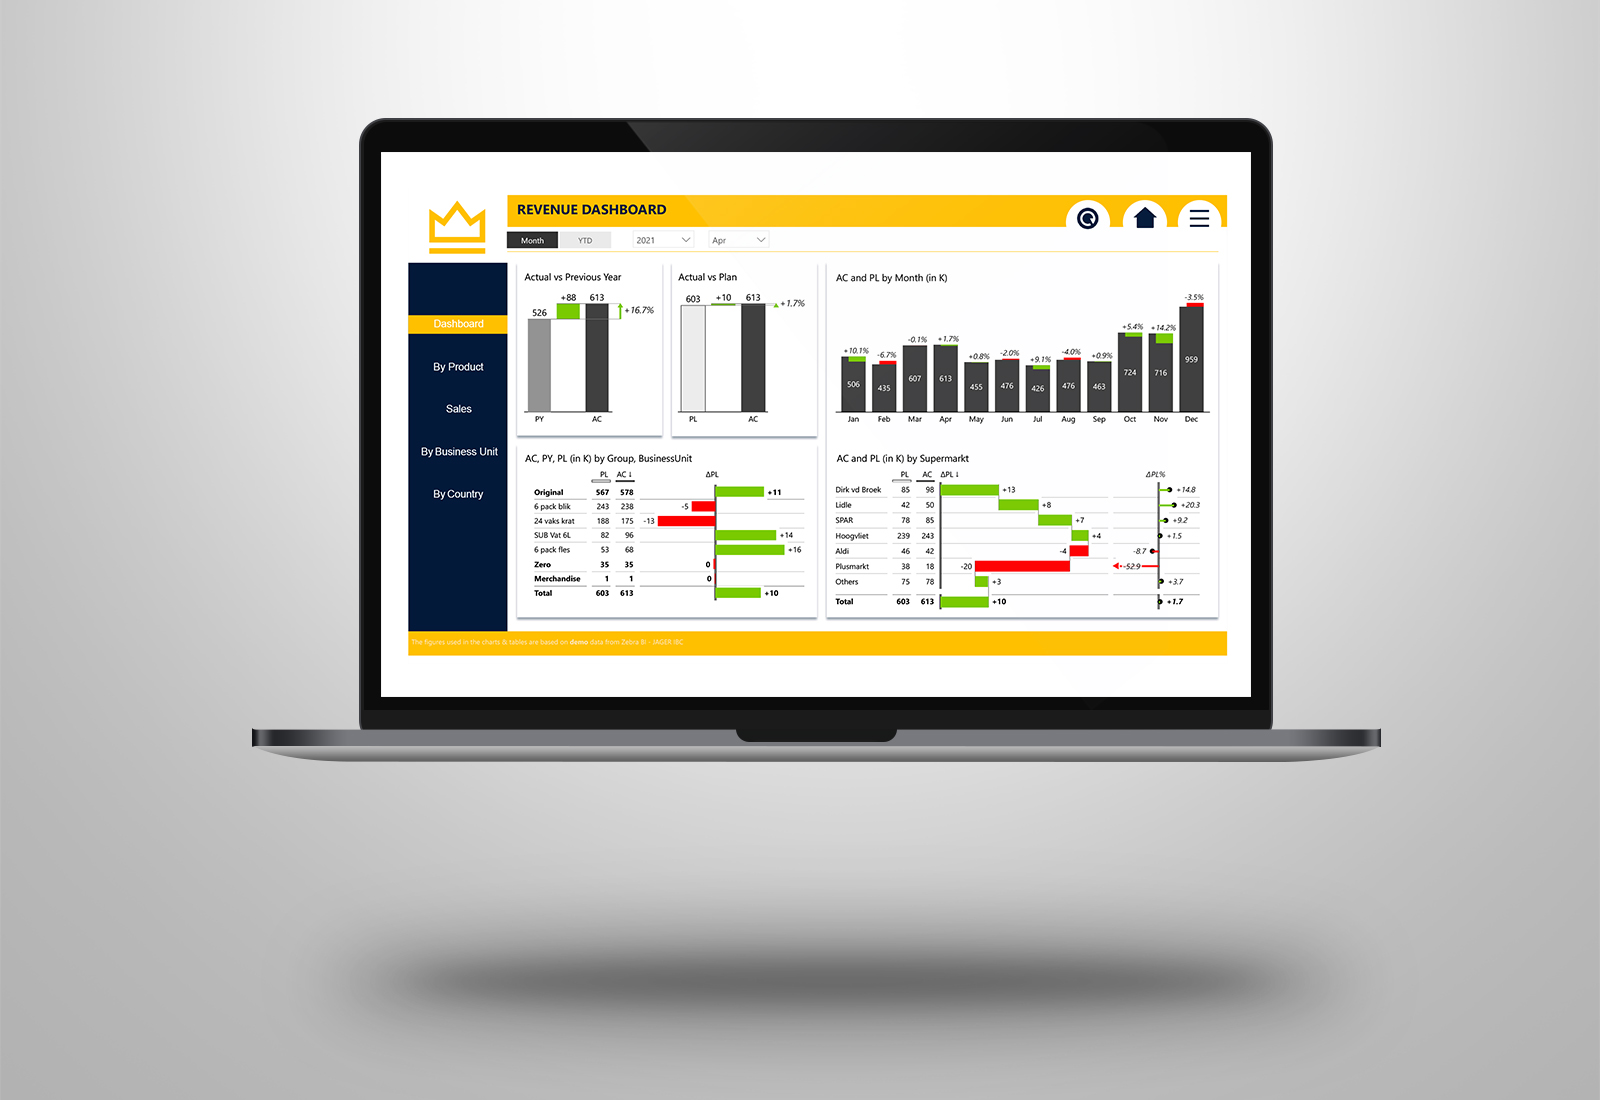
Power BI | UI design dashboard The Impact Group
kaboem2021-06-29T14:34:29+02:00our expertise Vorige week heb ik voor Pieter van Velze en zijn team van The Impact Group een leuke kennis sessie verzorgt over de ontwikkeling op het gebied van business reporting. Gesproken over IBCS – International Business Communication Standards, Zebra BI en Microsoft Power BI. The Impact Group is een full service recruitment >> Lees verder
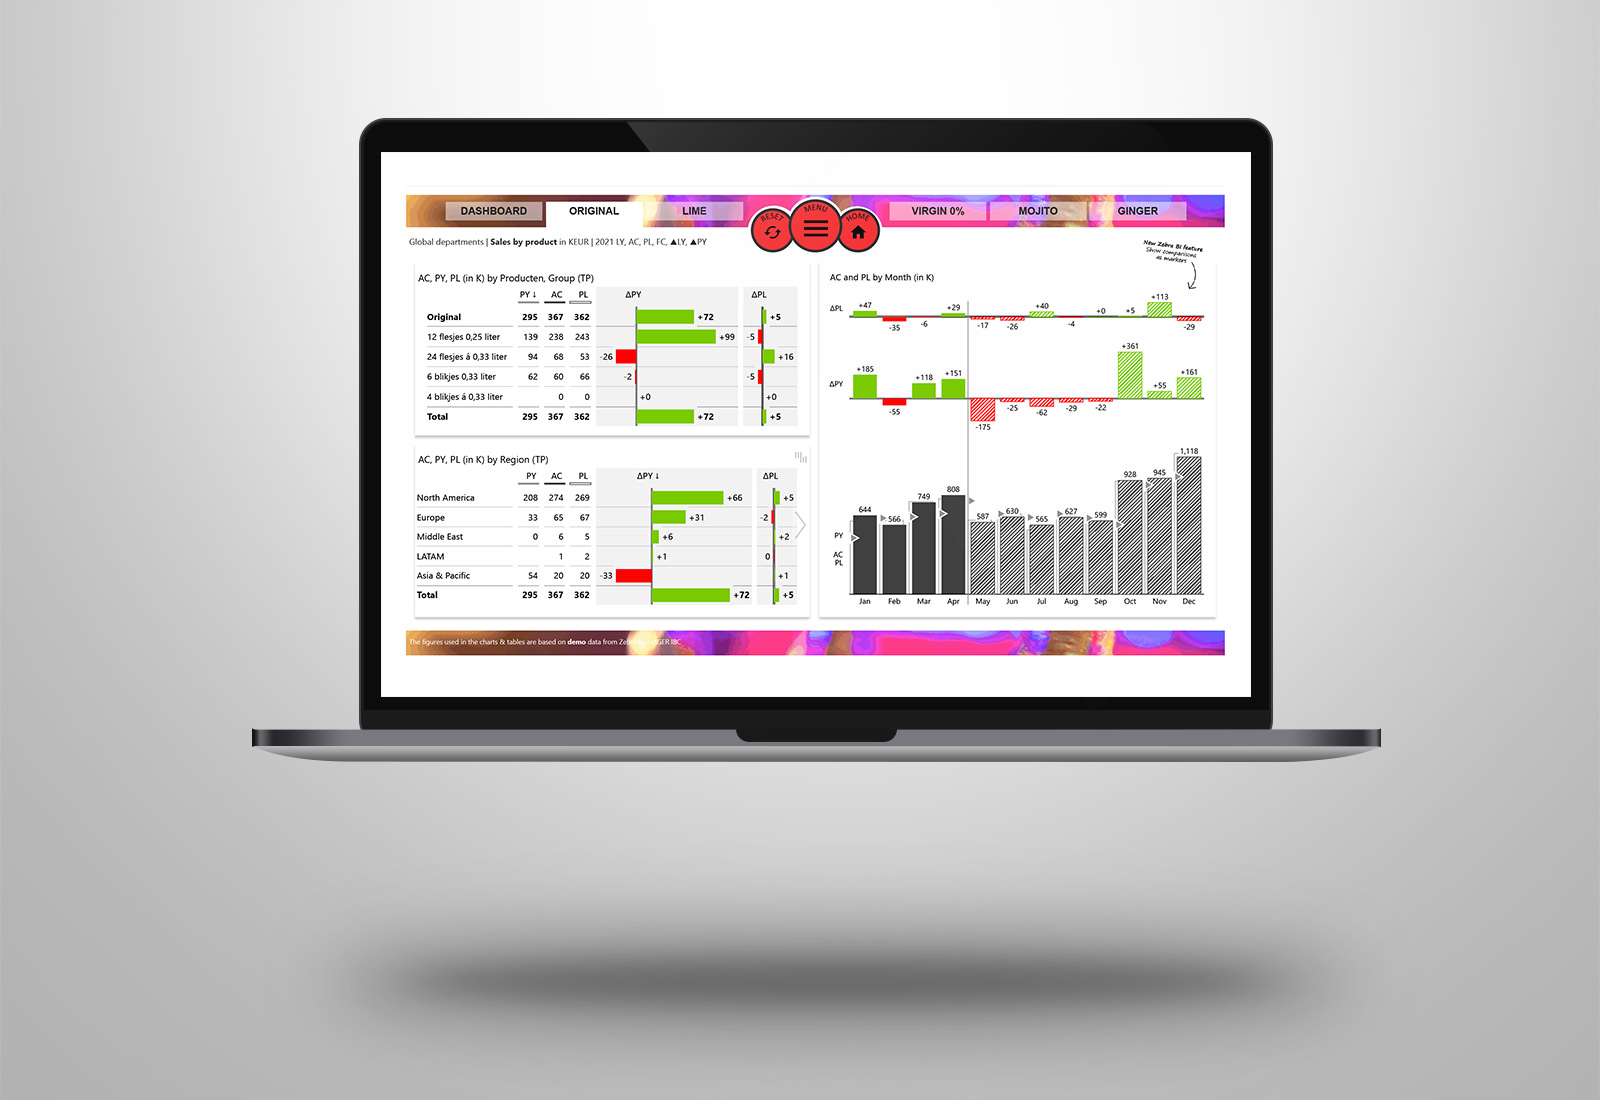
Power BI | UI design a la Desperados beer
Sasja Jager, de2021-06-29T14:19:38+02:00our expertise I already published the UI designed Power BI reports of Birra Moretti and Corona beer. The last of this “beer episode” should be Desperados. This is because I really like the design, every flavor has its own design identity. I thought it would be super fun to build a Microsoft Power BI >> Lees verder
Power BI | UI design a la Corona beer
Sasja Jager, de2025-11-14T13:14:22+01:00our expertise Two weeks ago I published a Power BI dashboard, UI design a la Birra Moretti. Because I also like Corona beer... I thought it would be super fun to build a Microsoft Power BI dashboard for Corona beer. A Power BI business report with the look and feel of the website, >> Lees verder
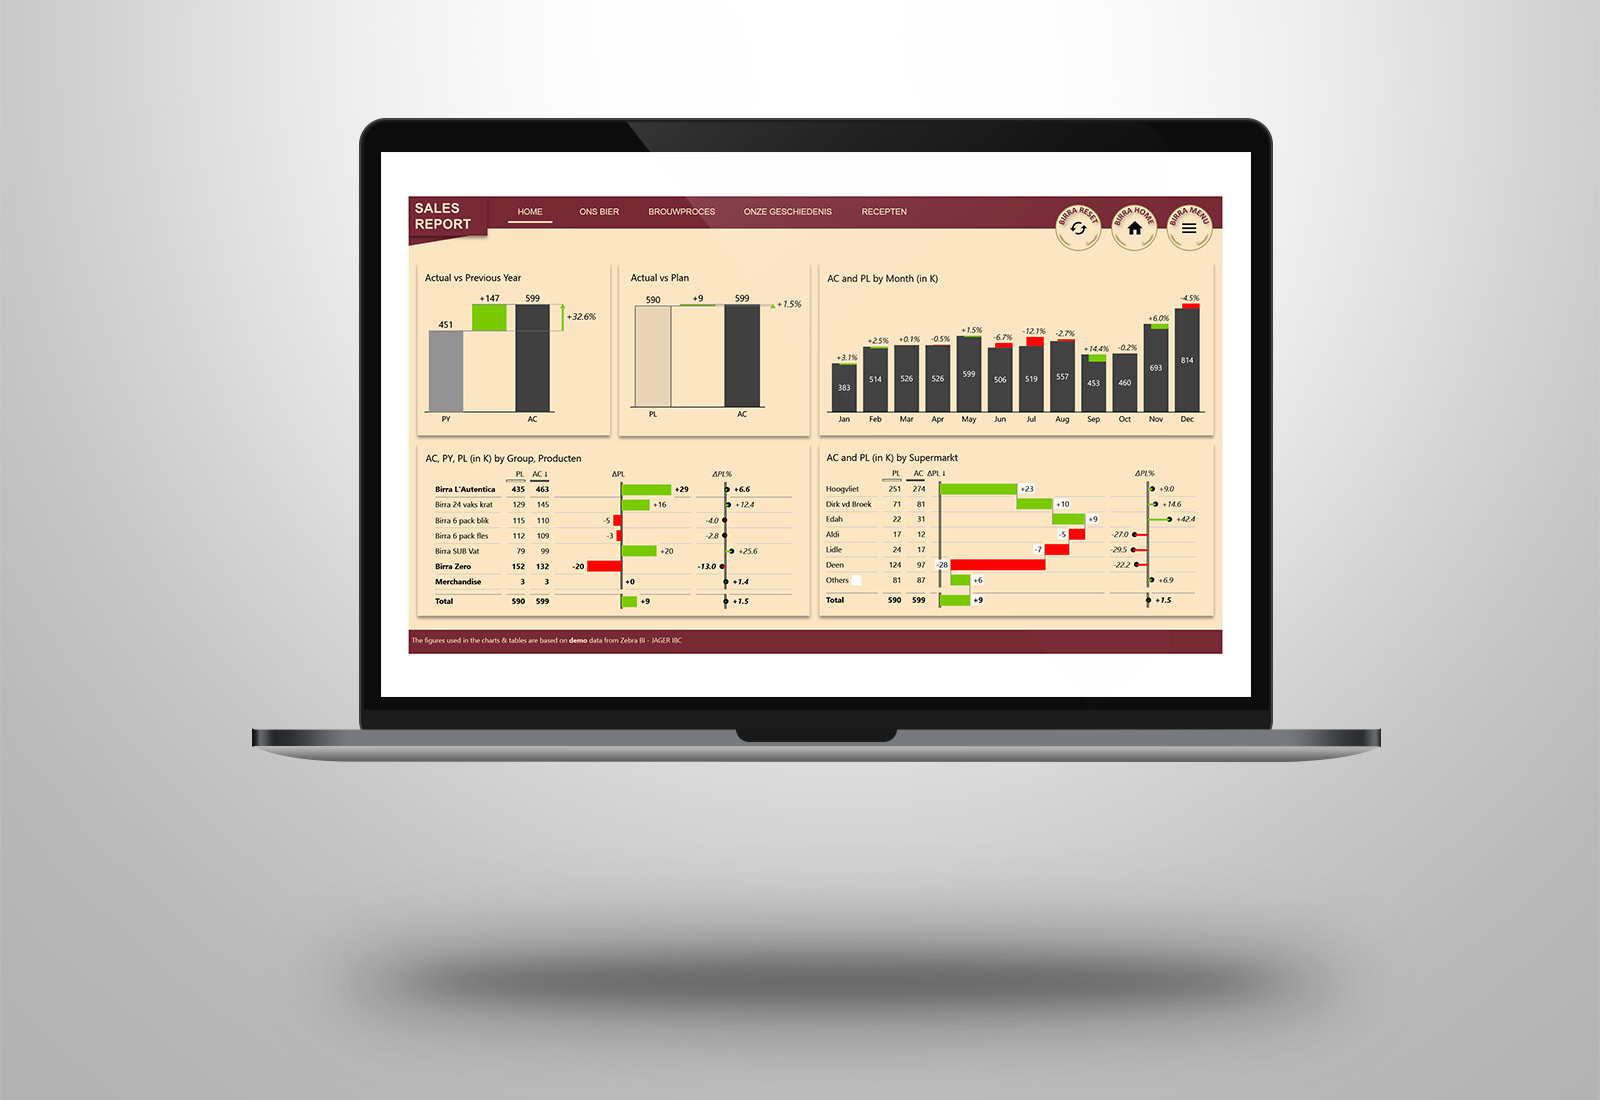
Power BI | UI design a la Birra Moretti
Sasja Jager, de2025-11-14T13:15:02+01:00our expertise Last week Heineken launched the Italian beer Birra Moretti in the Netherlands. Birra Moretti is a quality beer made in the traditional way. Getting excited about this launch, I thought it would be super fun to build a special Microsoft Power BI dashboard for this. A Power BI business report with >> Lees verder
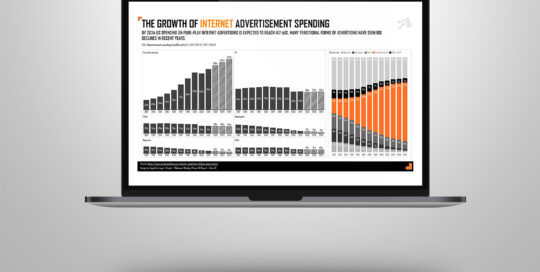
The growth of internet advertisement spending
Sasja Jager, de2021-03-18T11:57:08+01:00our expertise This week’s visualization is about the type of advertisement spending in the US as part of MakeoverMonday week 46. The original viz is from visualcapitalist. Created the visual in Power BI with the use of the Zebra BI visuals. My favorite is the use of the small multiples, very useful for >> Lees verder
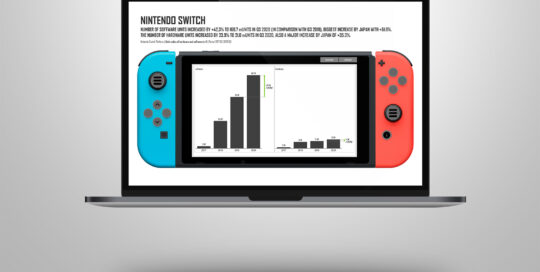
Visualizing -with- Nintendo
Sasja Jager, de2025-11-14T13:15:28+01:00our expertise This week’s visualization is about the number of sold Nintendo units (hardware and software) as part of MakeoverMonday week 45. The original viz is from Nintendo itself. Take a look at the original viz from Nintendo. It’s not easy to read if you use two Y-axes with different scaling for the >> Lees verder
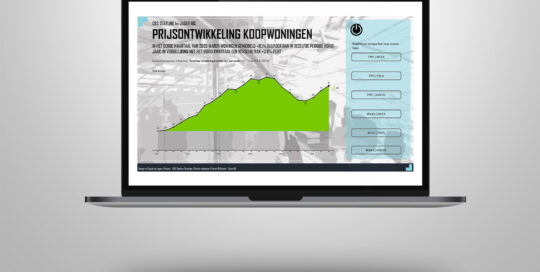
Prijs van koopwoningen
Sasja Jager, de2021-03-18T11:57:08+01:00our expertise Vorig week las ik een publicatie van het CBS omtrent de ontwikkeling van de prijs van koopwoningen. Deze publicatie werd vervolgens in veel andere media 1 op 1 overgenomen. Mij zijn veel dezelfde tekst citaten opgevallen, maar haast nergens zag ik een visualisatie ter ondersteuning van de boodschap. Zonde want het >> Lees verder
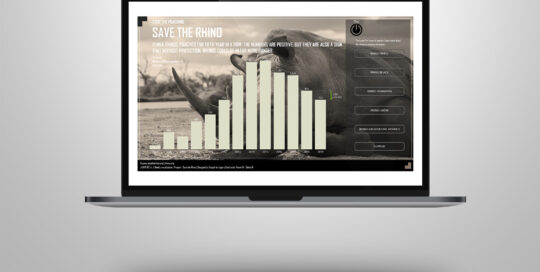
Save the rhino – stop the poaching
Sasja Jager, de2021-03-18T11:57:22+01:00our expertise Last week it was World Ranger Day 2020. I read an article about the brave men and women who are doing their best to stop the poaching of rhinos. Did you know that every 10 hours a rhino is poached? This week’s I decided to make a visualization of it and >> Lees verder