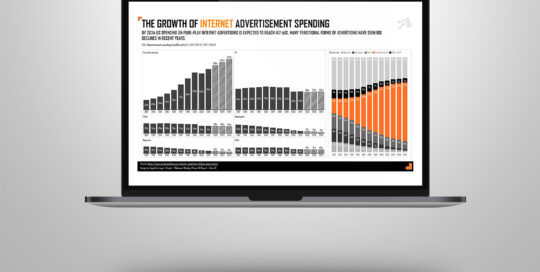
our expertise This week’s visualization is about the type of advertisement spending in the US as part of MakeoverMonday week 46. The original viz is from visualcapitalist. Created the visual in Power BI with the use of the Zebra BI visuals. My favorite is the use of the small multiples, very useful for >> Lees verder
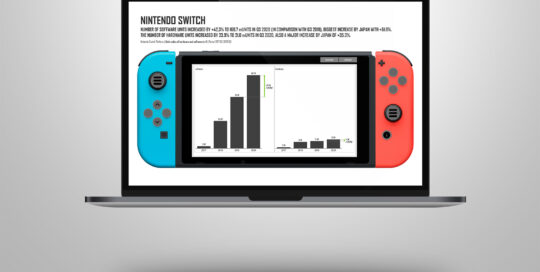
Visualizing -with- Nintendo
Sasja Jager, de2021-03-18T11:57:08+01:00our expertise This week’s visualization is about the number of sold Nintendo units (hardware and software) as part of MakeoverMonday week 45. The original viz is from Nintendo itself. Take a look at the original viz from Nintendo. It’s not easy to read if you use two Y-axes with different scaling for the >> Lees verder
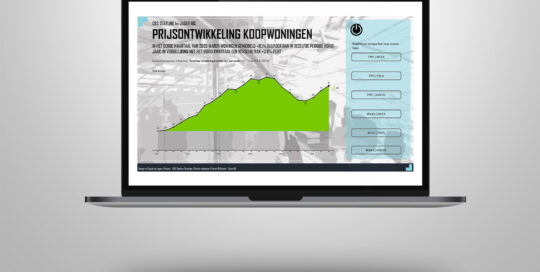
Prijs van koopwoningen
Sasja Jager, de2021-03-18T11:57:08+01:00our expertise Vorig week las ik een publicatie van het CBS omtrent de ontwikkeling van de prijs van koopwoningen. Deze publicatie werd vervolgens in veel andere media 1 op 1 overgenomen. Mij zijn veel dezelfde tekst citaten opgevallen, maar haast nergens zag ik een visualisatie ter ondersteuning van de boodschap. Zonde want het >> Lees verder
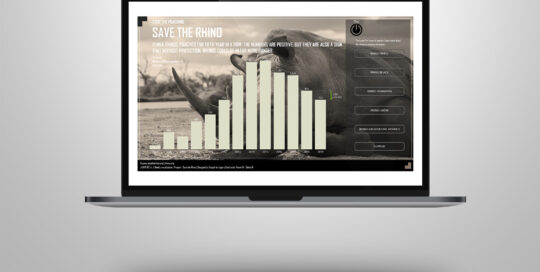
Save the rhino – stop the poaching
Sasja Jager, de2021-03-18T11:57:22+01:00our expertise Last week it was World Ranger Day 2020. I read an article about the brave men and women who are doing their best to stop the poaching of rhinos. Did you know that every 10 hours a rhino is poached? This week’s I decided to make a visualization of it and >> Lees verder
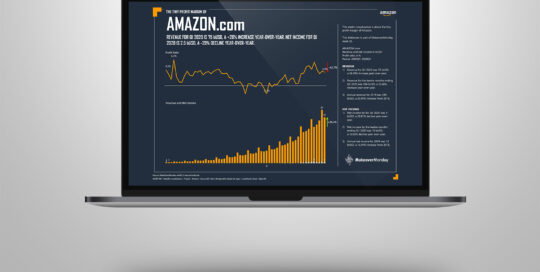
Visualizing the tiny profit margin of Amazon.com
Sasja Jager, de2021-03-18T11:57:08+01:00our expertise This week’s visualization is about the tiny profit margin of Amazon.com as part of MakeoverMonday week 25. This week I used the charts of Zebra BI to show the development of the revenue and the profit margin. As a difference to the original Viz I created a separate line chart with >> Lees verder
