Power BI | Save The Queen design of a start page with animation effects
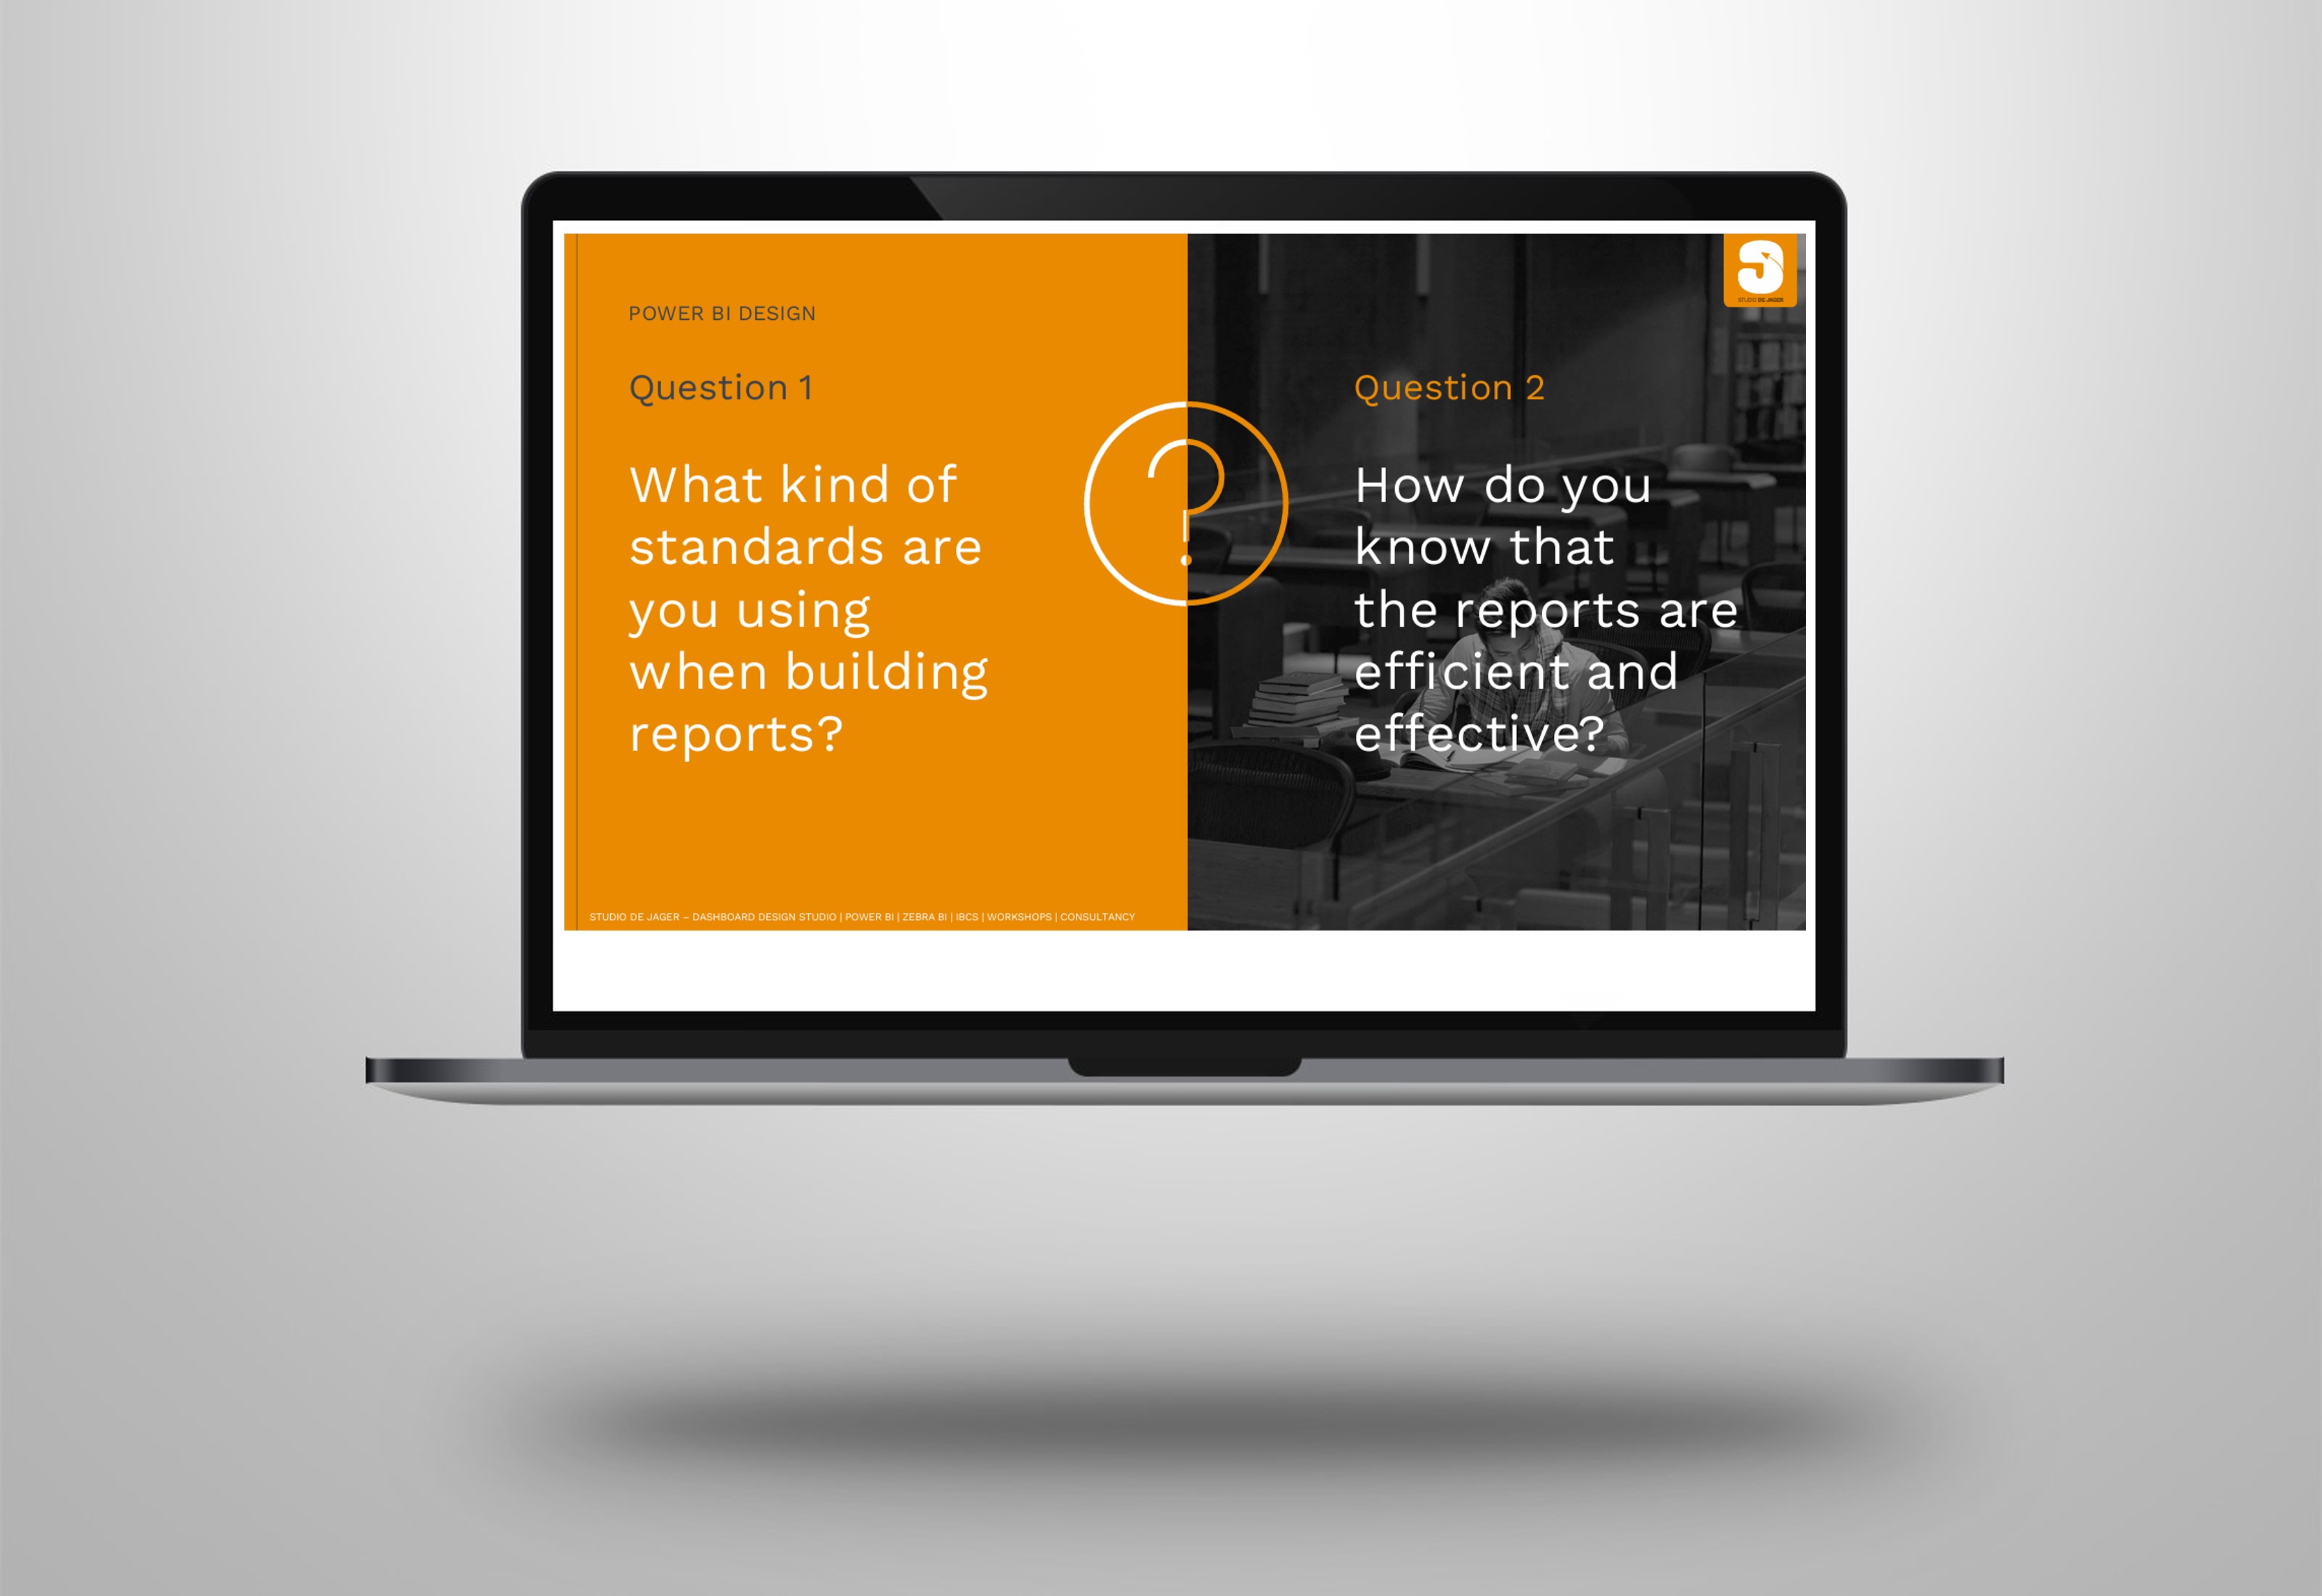
What is the first page to look at when you open a website? What is the first page when you open a Power Point presentation?
It is a landing page or start page, which gives you a nice company feeling to start with.
And what is the first page to look at when you open a Power BI report ….. ? Very often you start immediately in a report page.
Why don’t create a start page for Power BI reports, the same as for websites and Power Point presentations? And why not add some animation effects to that page …. to give it some extra glance.
How does that look?
Link to the video: https://www.loom.com/share/b44228bfd15d4defb05d7422e7556587
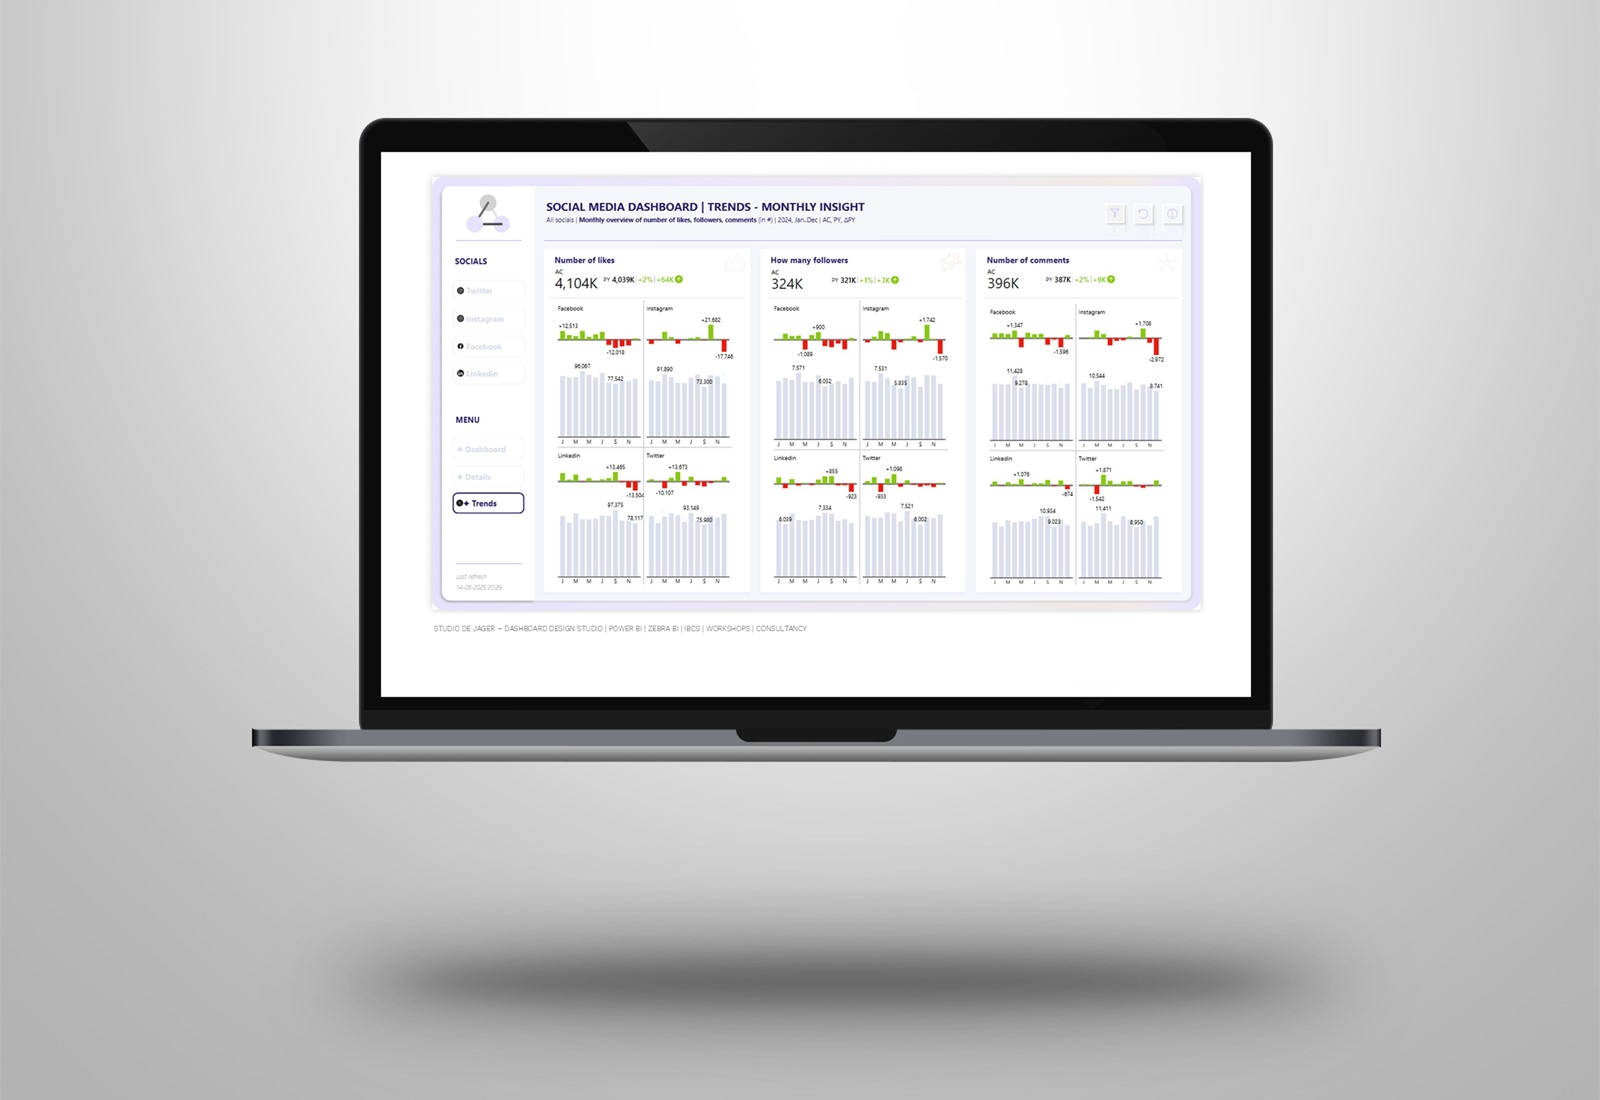
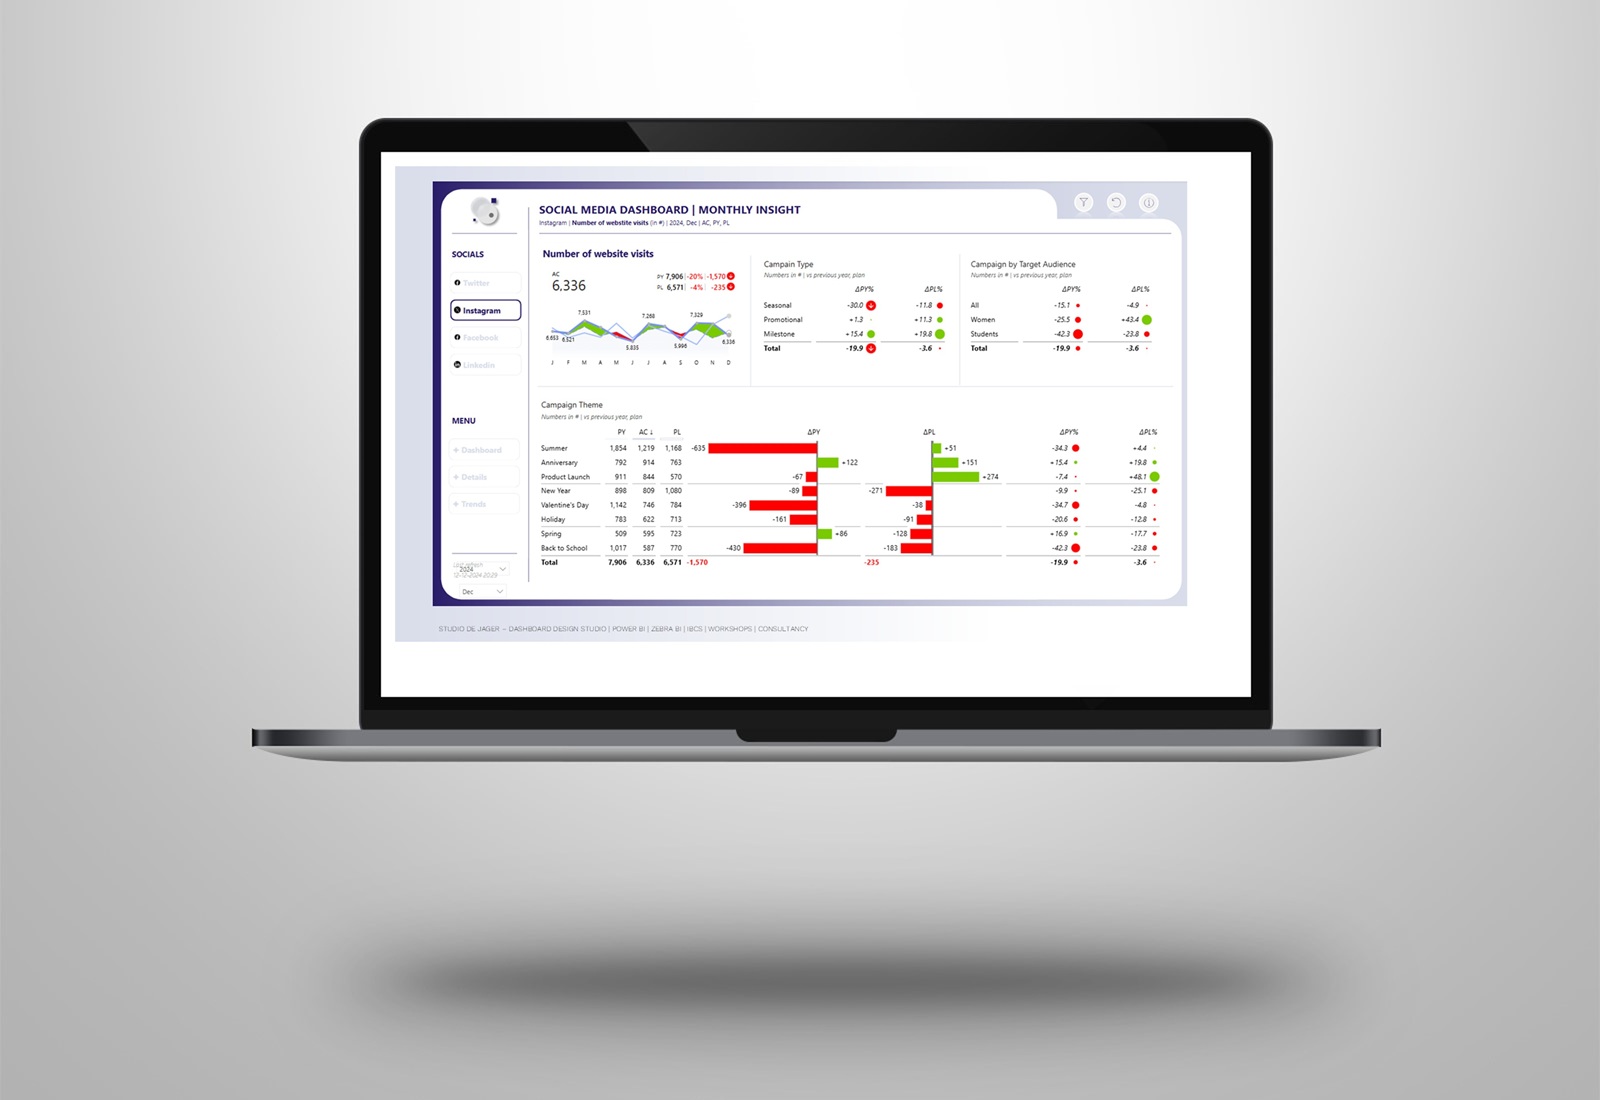
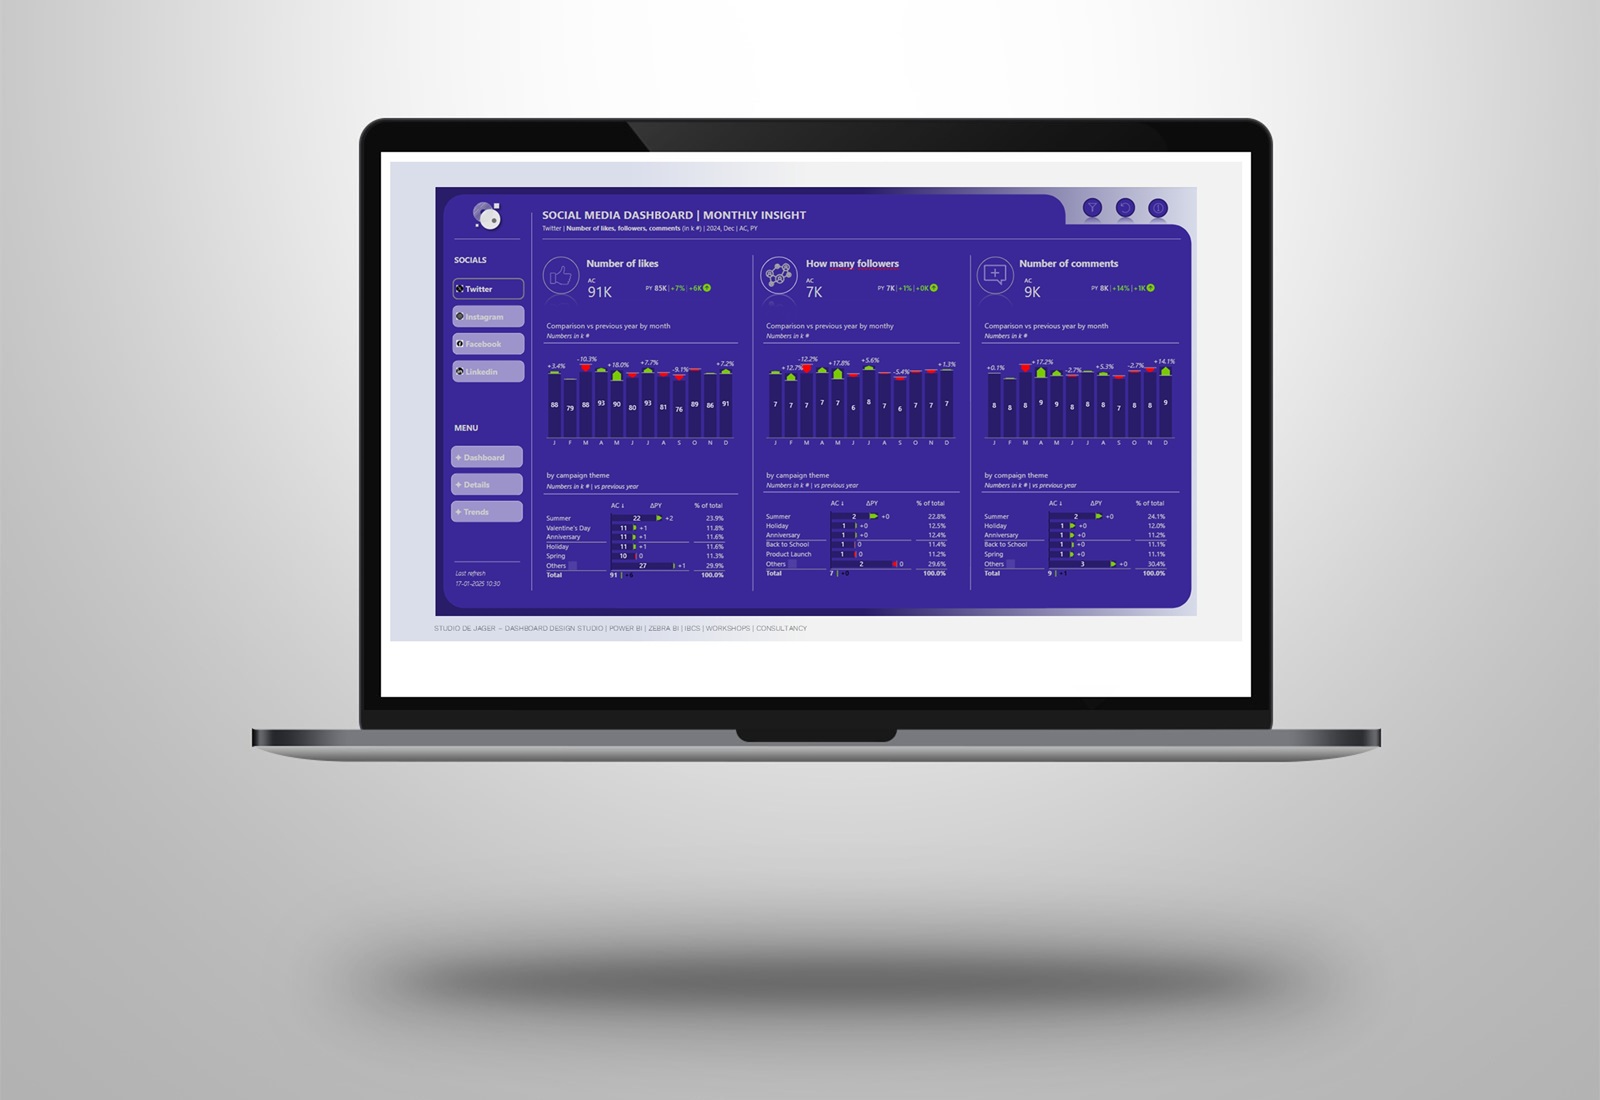
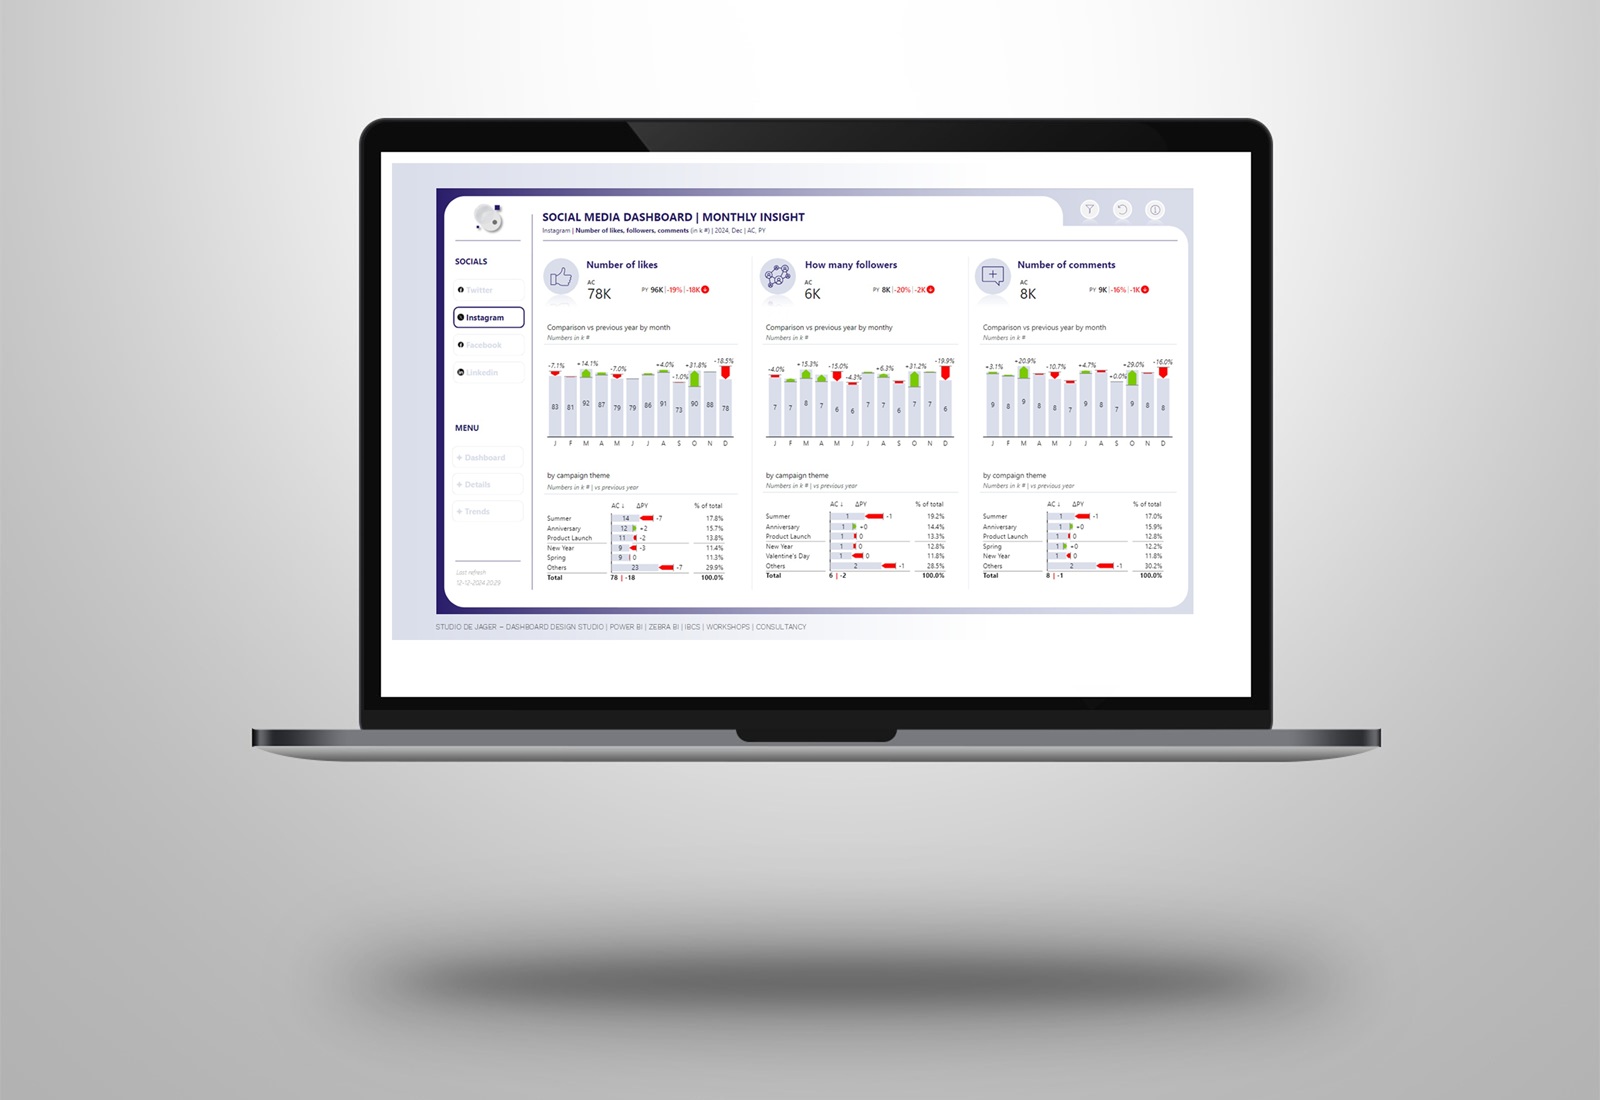
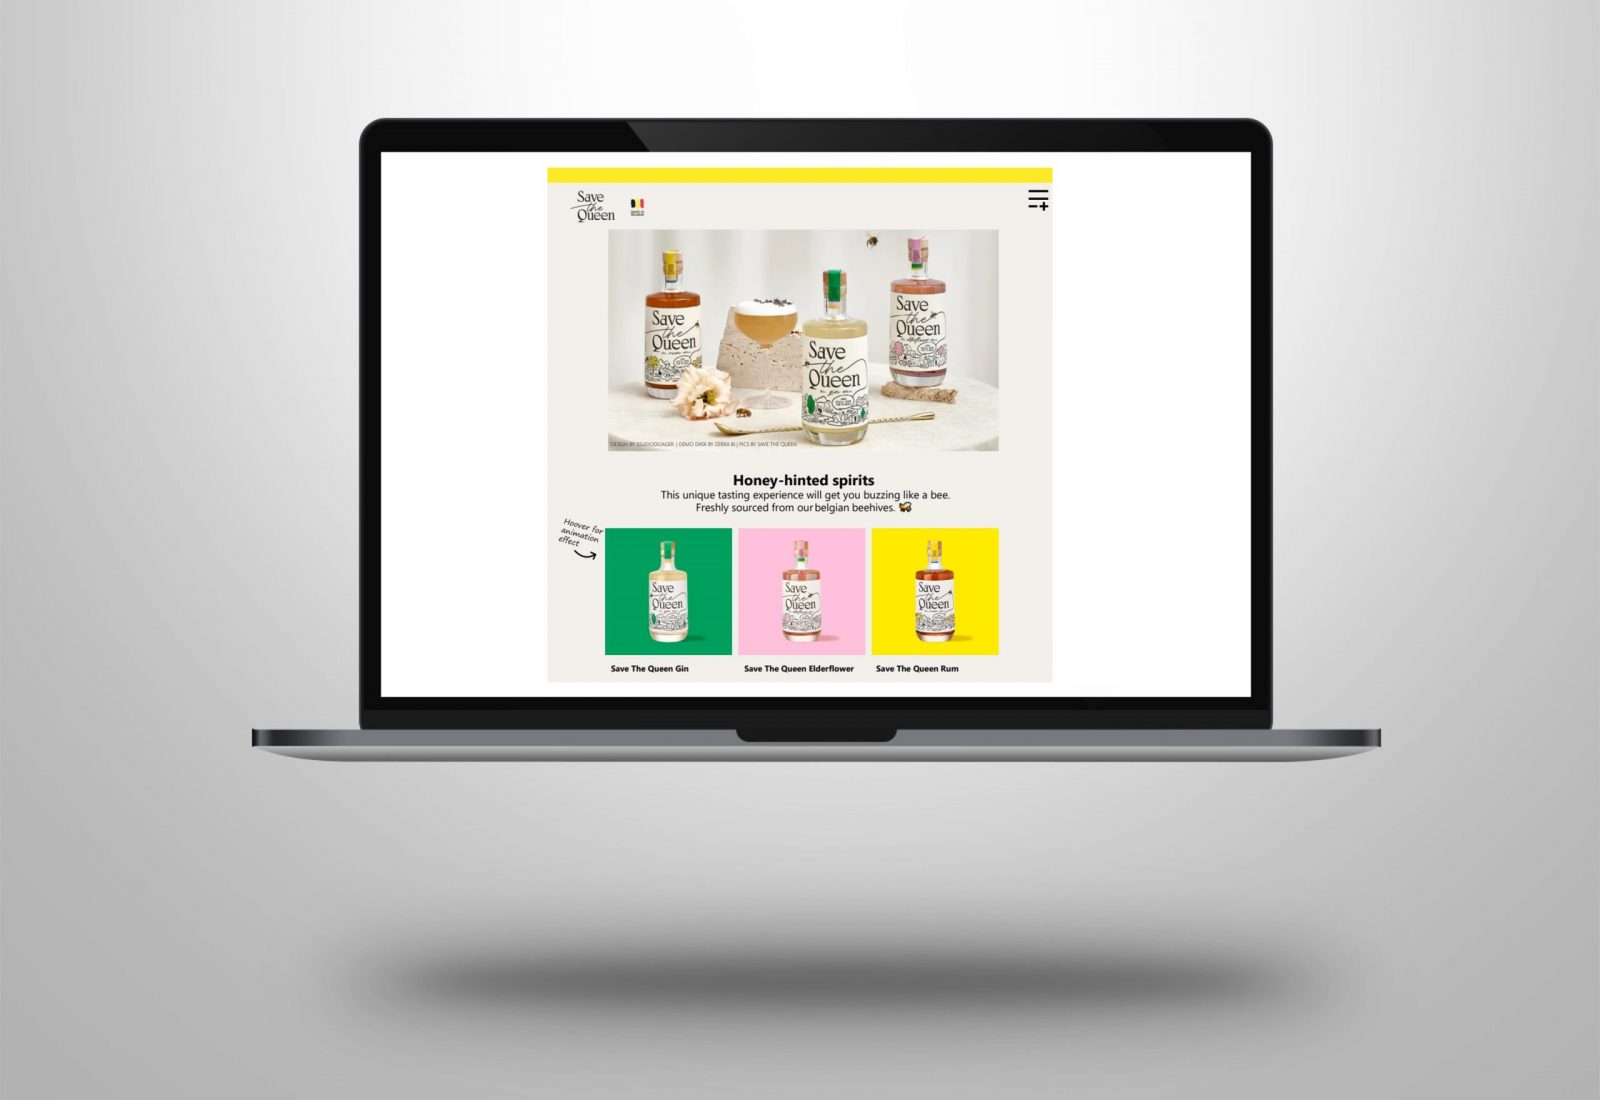
I thought it would be fun to make a Save The Queen designed Power BI report in which you can find a lot of interesting animation effects.
- Created the animation effects by applying some extra codes to the .svg files.
- Svg files can used in a background pictures or icons and contains a specific code. This code can be edited and you can provide it with some extra code.
- I use Animista for all the animation codes.
- Used it on background pics, icons and also in the custom tooltips.
- Created a custom canvas setting of the Power BI report
- Used demo data and visuals from Zebra BI and pictures from Save The Queen.
Thanks Jefferson Alves for the inspiration and ideas.
About Save The Queen
A Belgium company which makes well-crafted gin, elderflower and rum. They work together closely with bee-friends. In return for their golden nectar, each bottle contributes to protecting and sustaining our urban bee populations. By bees for bees
Thanks Save The Queen for using your branding. (https://www.savethequeen.be/)
In the comments the screenshots of the dashboard.
I’m excited about the result, hope you like it !
Do you also want to have a nicely designed Power BI dashboard?
Let’s get in touch !
Sasjah de Jager | studiodejager.nl
Report & dashboard design | Official Zebra BI Partner | Power BI – Excel | IBCS Certified Analyst | Data visualization | Interim business consultancy
Let’s create better reports & dashboards !
#zebrabi #visualization #powerbi #report #dashboard #UX #UI design #ibcs #design