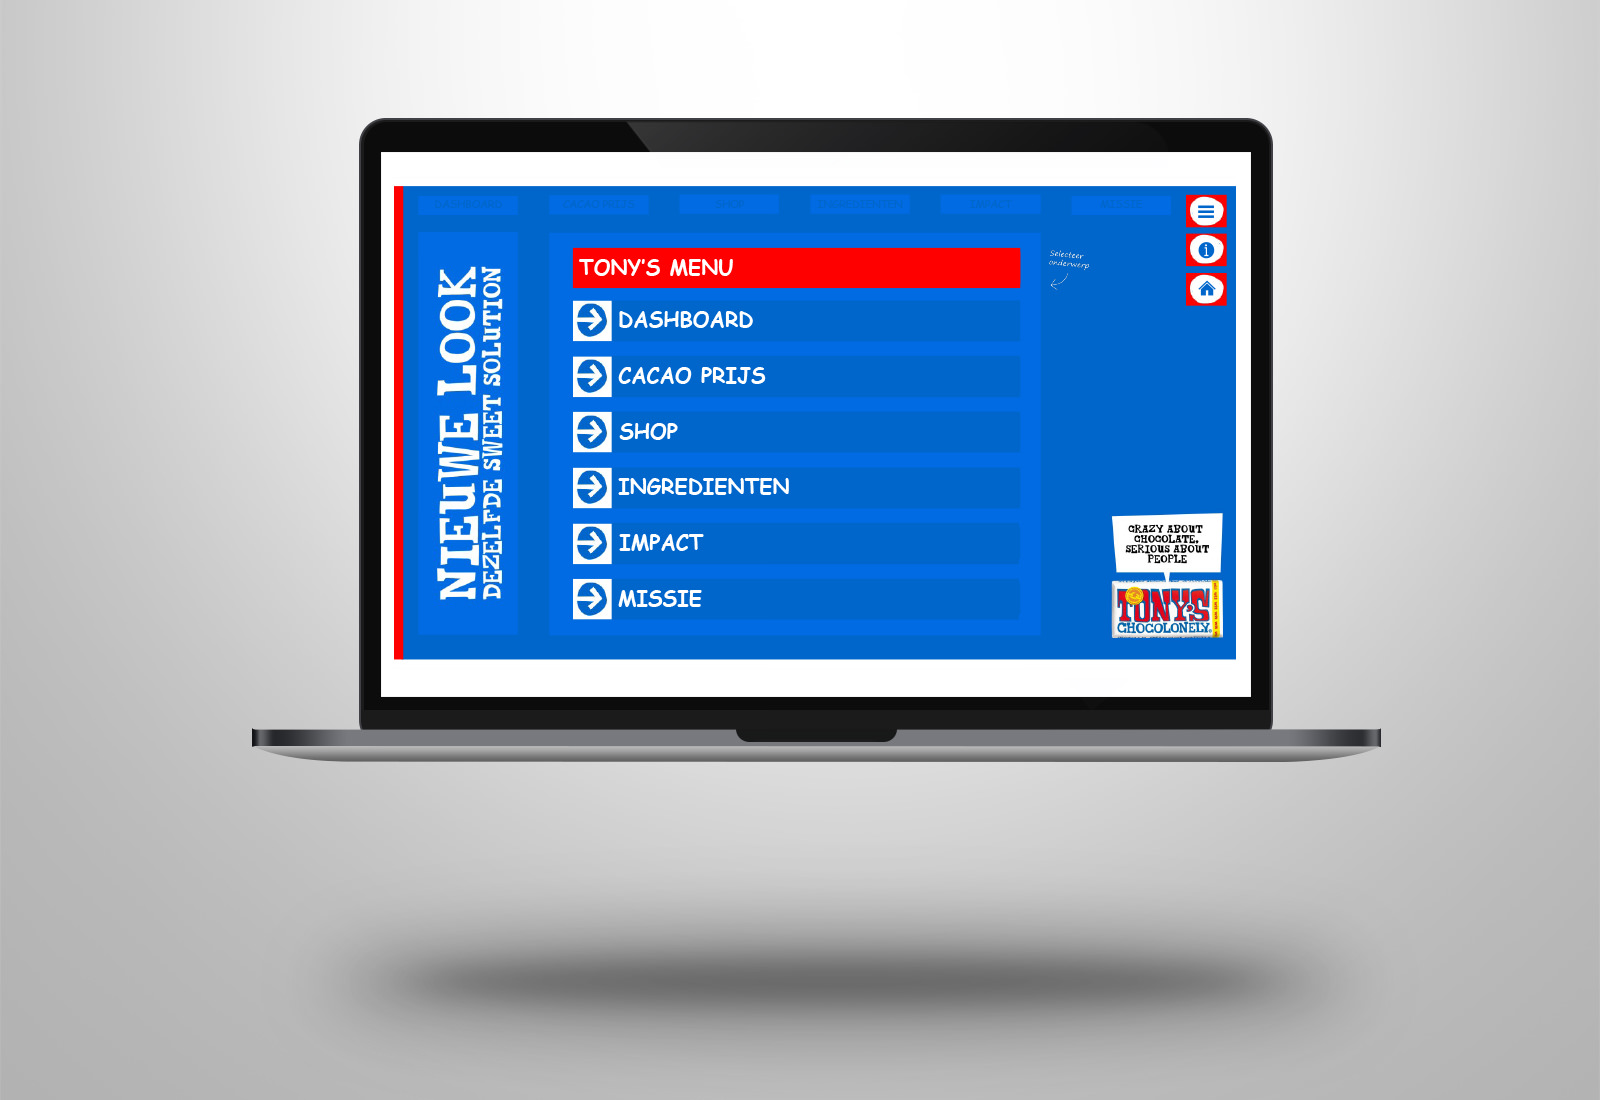
Power BI | Tony’s Chocolonely dashboard
our expertise All chocolate 100% slave free. Worldwide. That's the mission of Tony's Chocolonely. On 1 October, the Government of Côte d'Ivoire announced that the new farmgate price for this harvest season will >> Lees verder
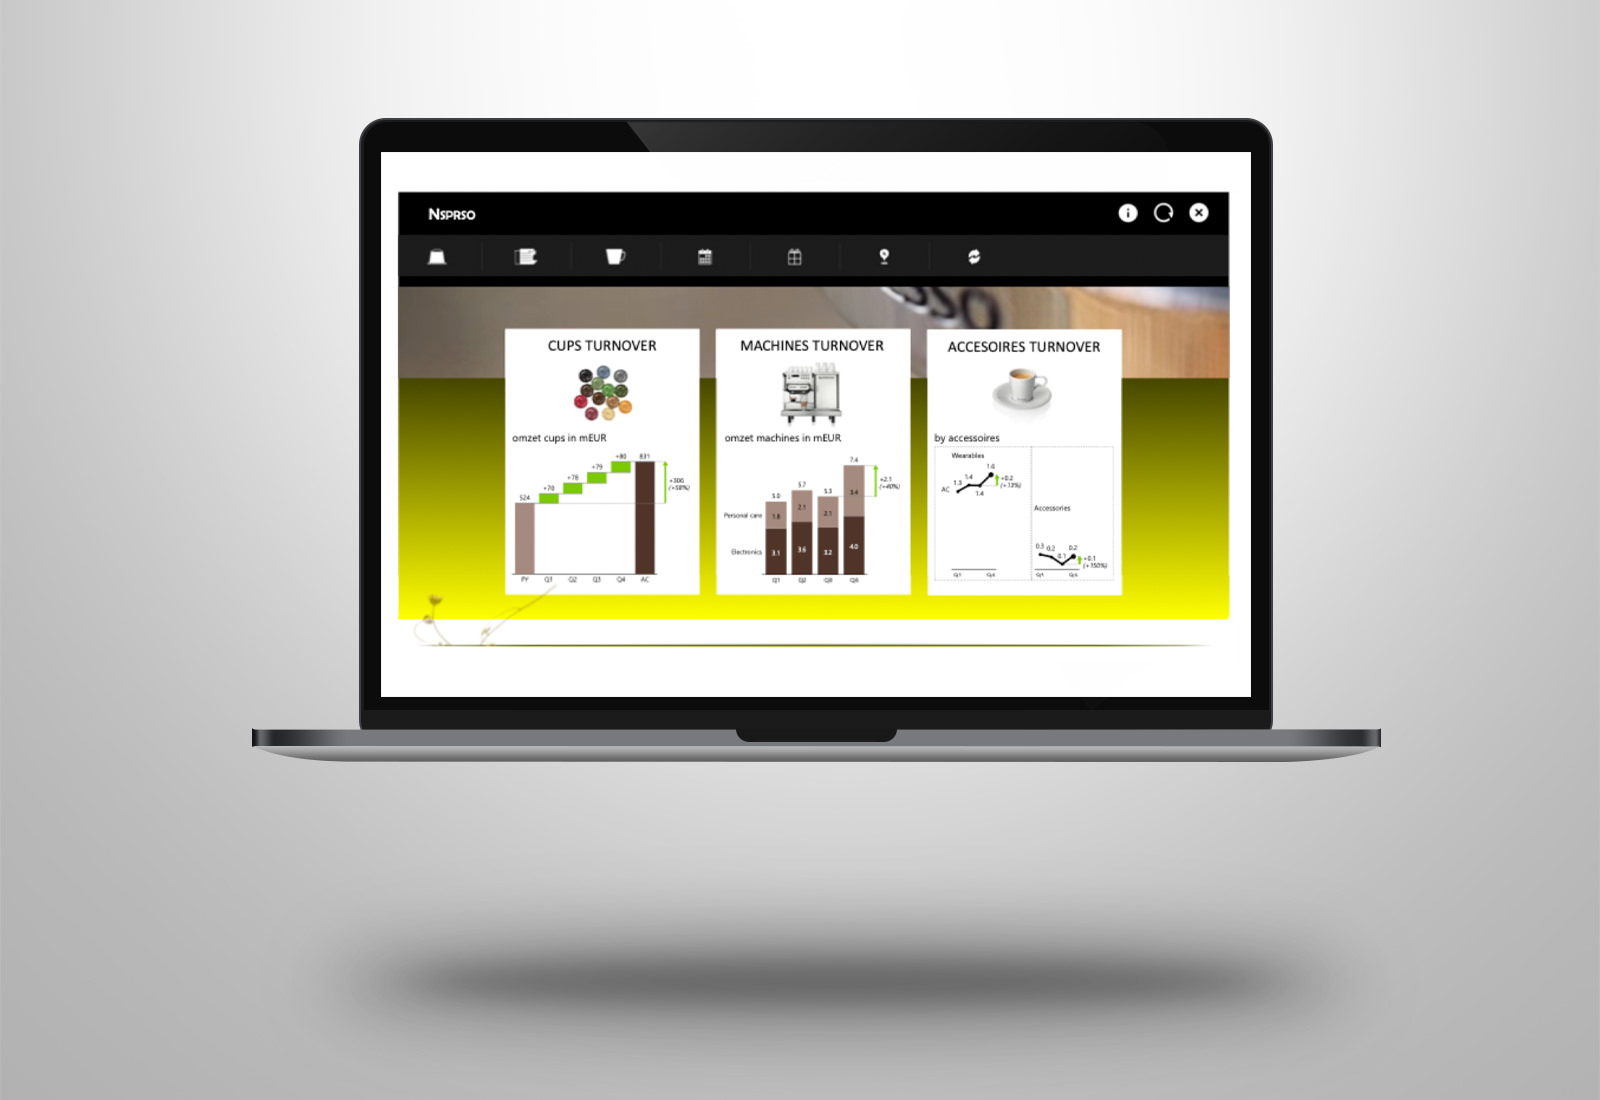
Power BI | Nespresso coffee dashboard
our expertise How do you drink your coffee? Many people are working at home during the corona period. One of the advantages of this is that we can choose our own coffee. I >> Lees verder
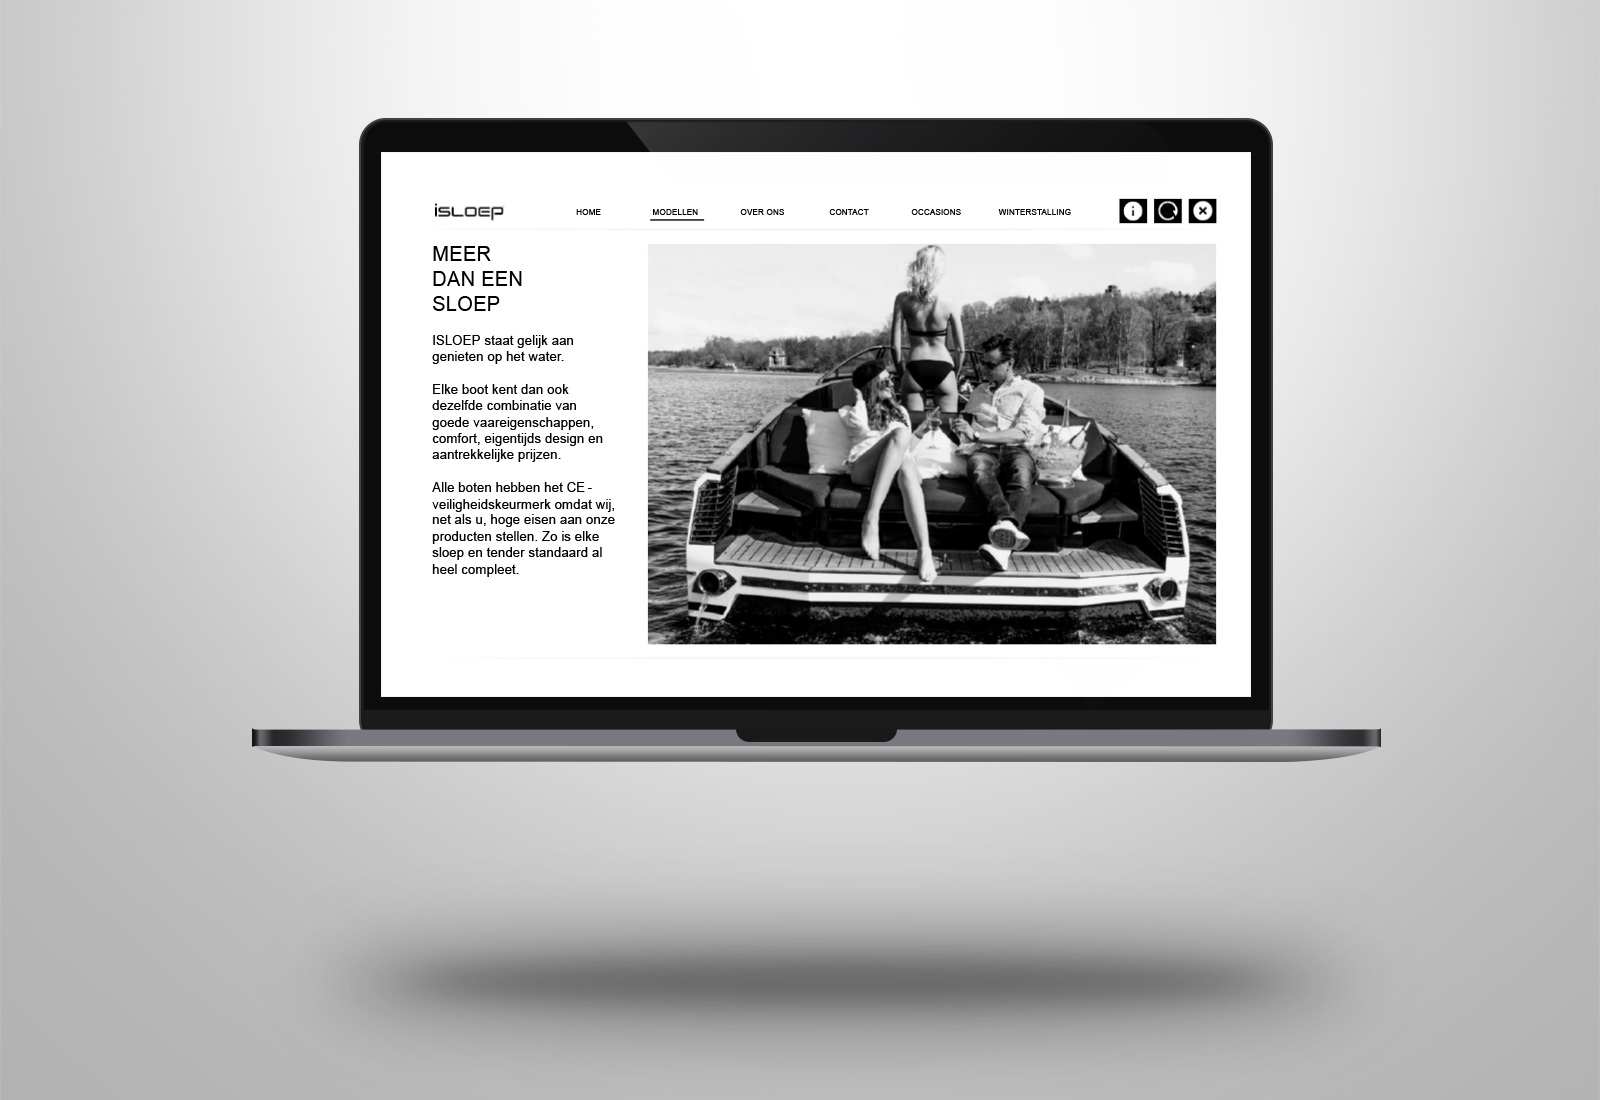
Power BI | Isloep dashboard
our expertise During the summer period I’d like to spent a lot of time on my boat with my family and friends. We always have fun and sailing with the boot gives a >> Lees verder

Power BI | Paw Patrol dashboard animation
our expertise This week something totally different, no business report in Power BI. Inspired by earlier work of Armand van Amersfoort (Horse Power BI) I decided to make an animation in Microsoft Power >> Lees verder

Power BI | UI design dashboard The Impact Group
our expertise Vorige week heb ik voor Pieter van Velze en zijn team van The Impact Group een leuke kennis sessie verzorgt over de ontwikkeling op het gebied van business reporting. Gesproken over >> Lees verder
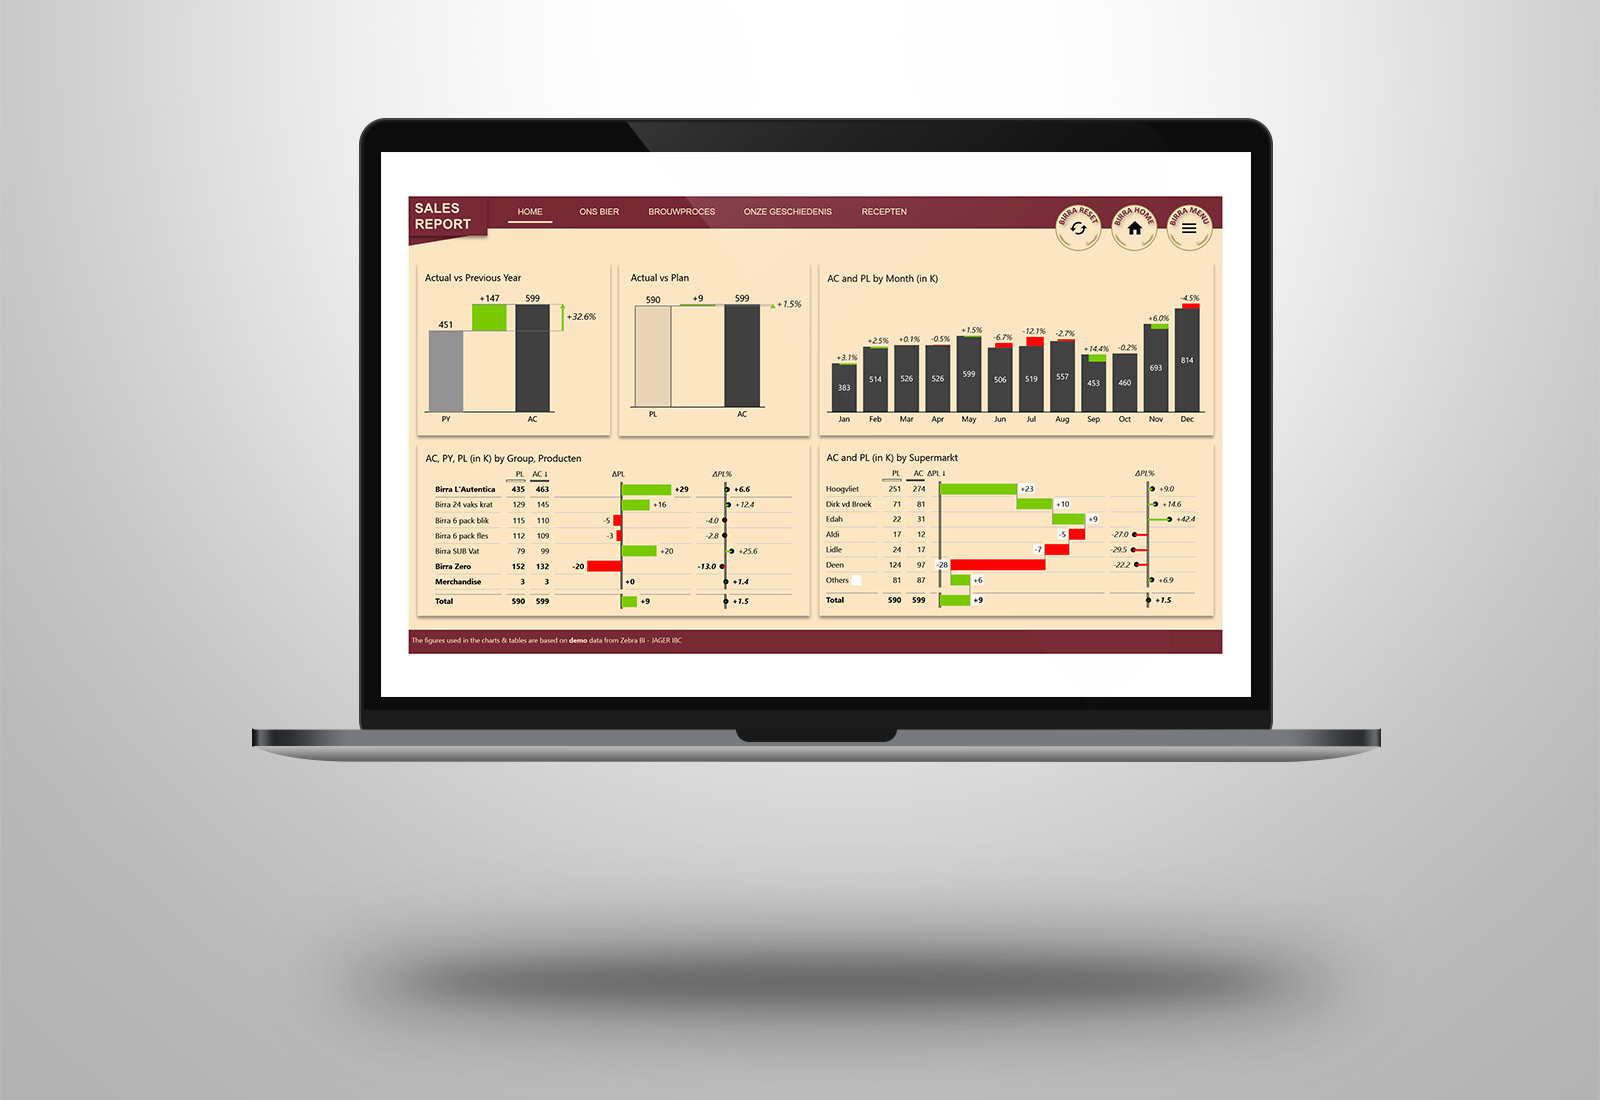
Power BI | UI design a la Desperados beer
our expertise I already published the UI designed Power BI reports of Birra Moretti and Corona beer. The last of this “beer episode” should be Desperados. This is because I really like the design, >> Lees verder
Power BI | UI design a la Corona beer
our expertise Two weeks ago I published a Power BI dashboard, UI design a la Birra Moretti. Because I also like Corona beer... I thought it would be super fun to build a >> Lees verder
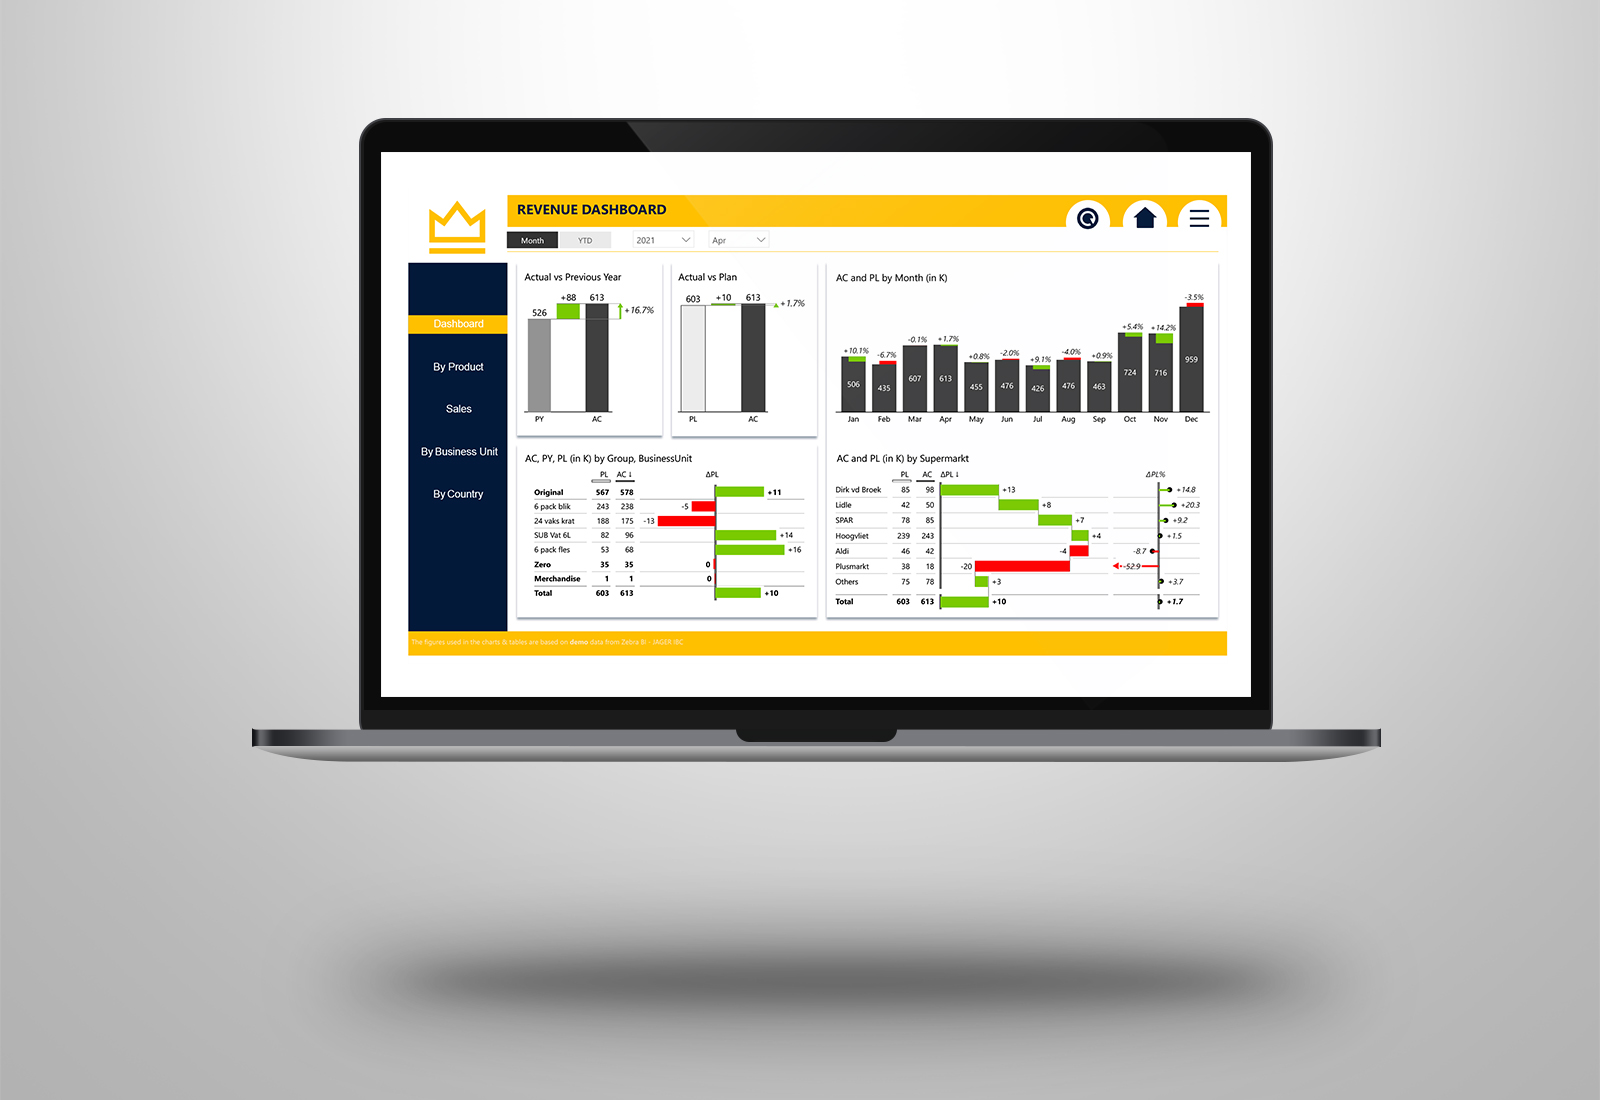
Power BI | UI design a la Birra Moretti
our expertise Last week Heineken launched the Italian beer Birra Moretti in the Netherlands. Birra Moretti is a quality beer made in the traditional way. Getting excited about this launch, I thought it >> Lees verder
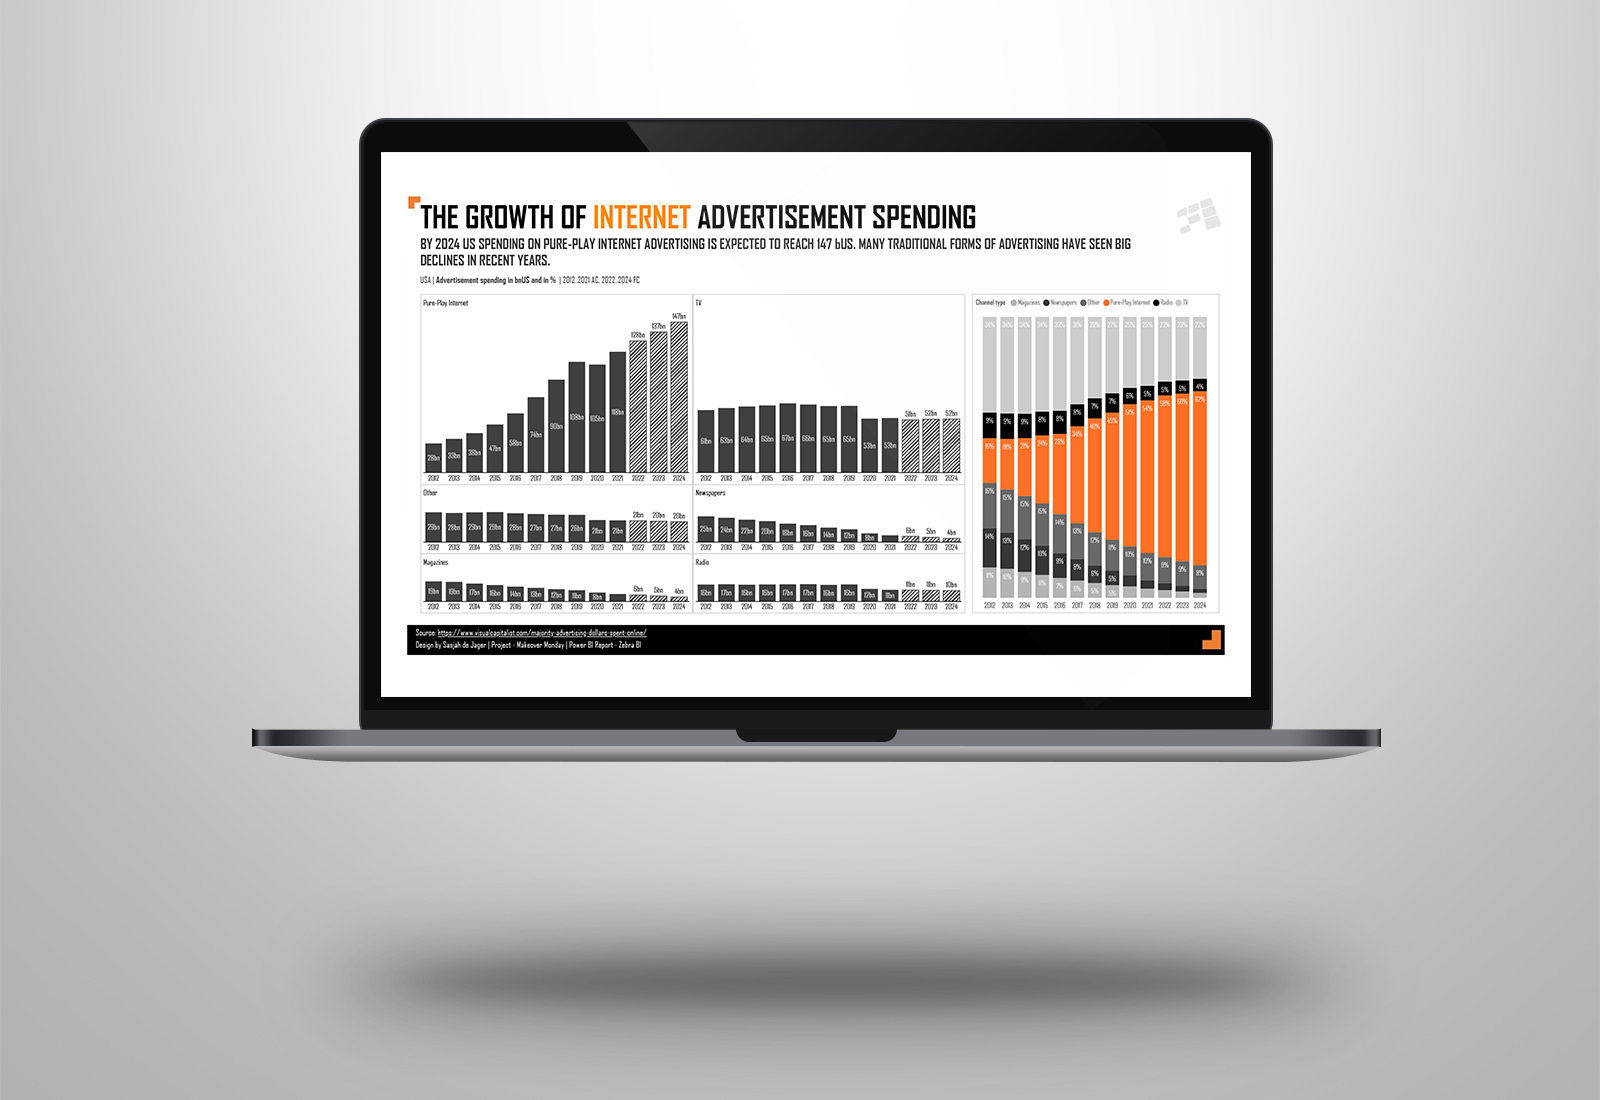
The growth of internet advertisement spending
our expertise This week’s visualization is about the type of advertisement spending in the US as part of MakeoverMonday week 46. The original viz is from visualcapitalist. Created the visual in Power BI >> Lees verder
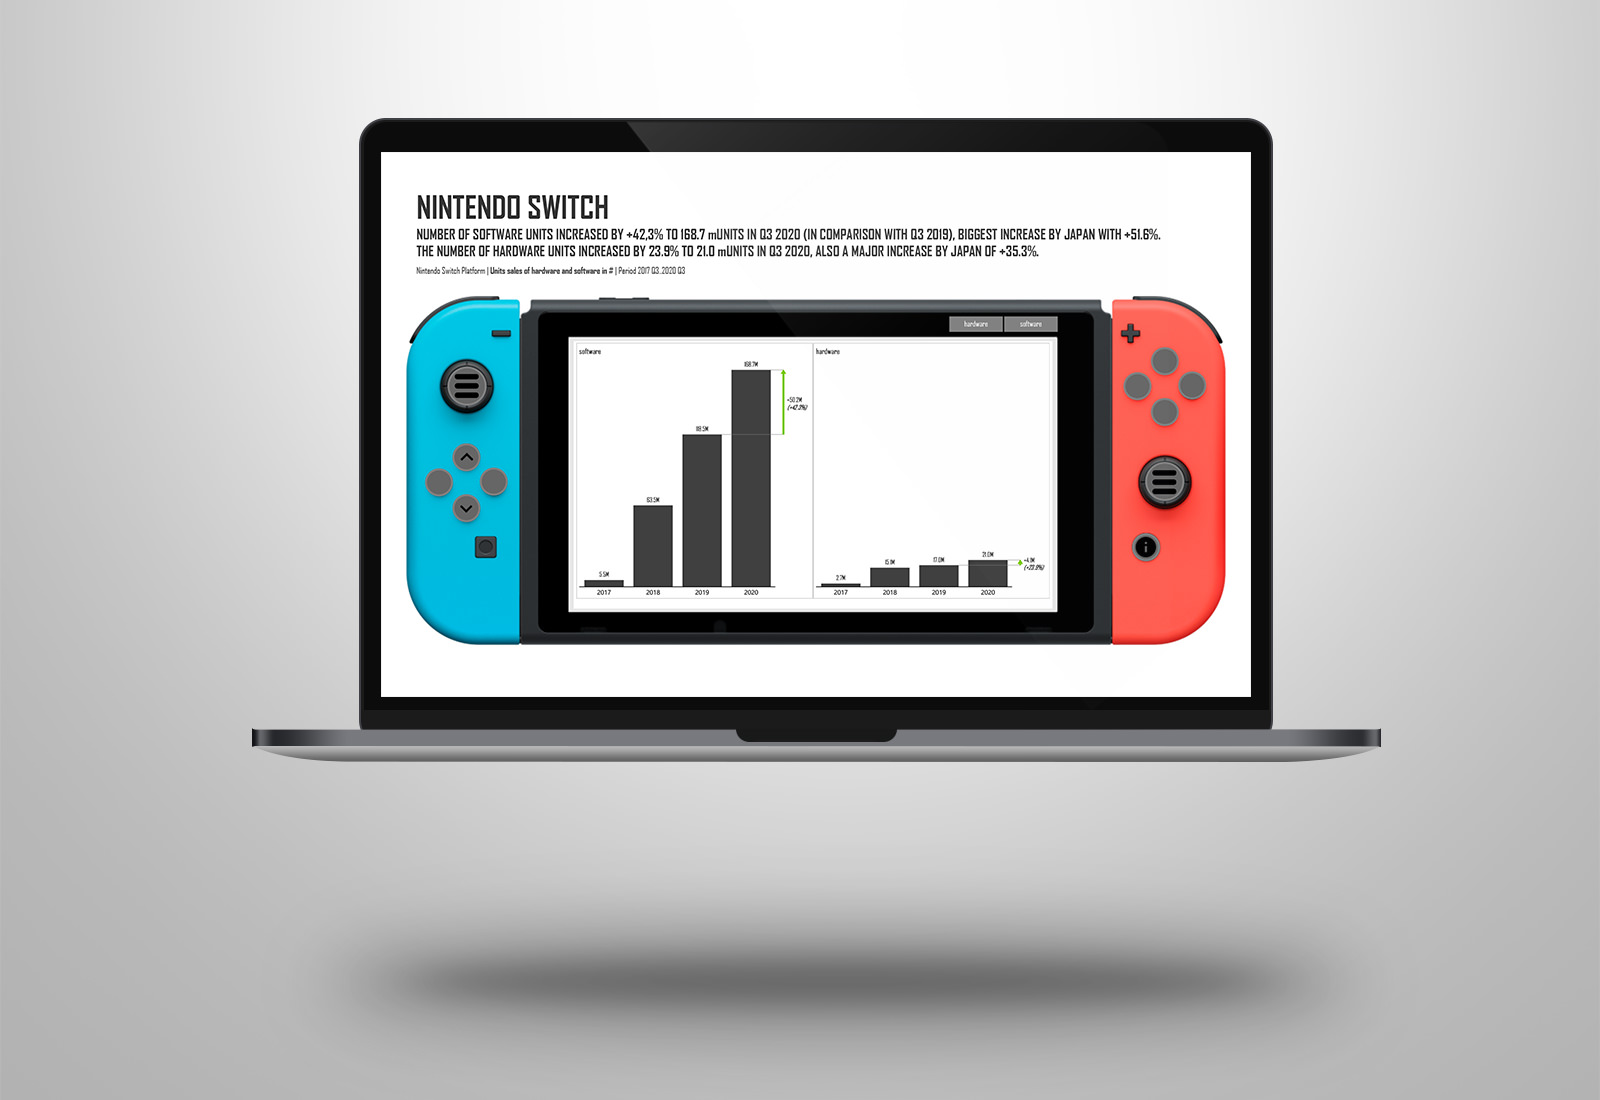
Visualizing -with- Nintendo
our expertise This week’s visualization is about the number of sold Nintendo units (hardware and software) as part of MakeoverMonday week 45. The original viz is from Nintendo itself. Take a look at >> Lees verder