Power BI | KIA EV9
What do you think of the new car from 𝐊𝐈𝐀, 𝐭𝐡𝐞 𝐦𝐨𝐝𝐞𝐥 𝐄𝐕9?
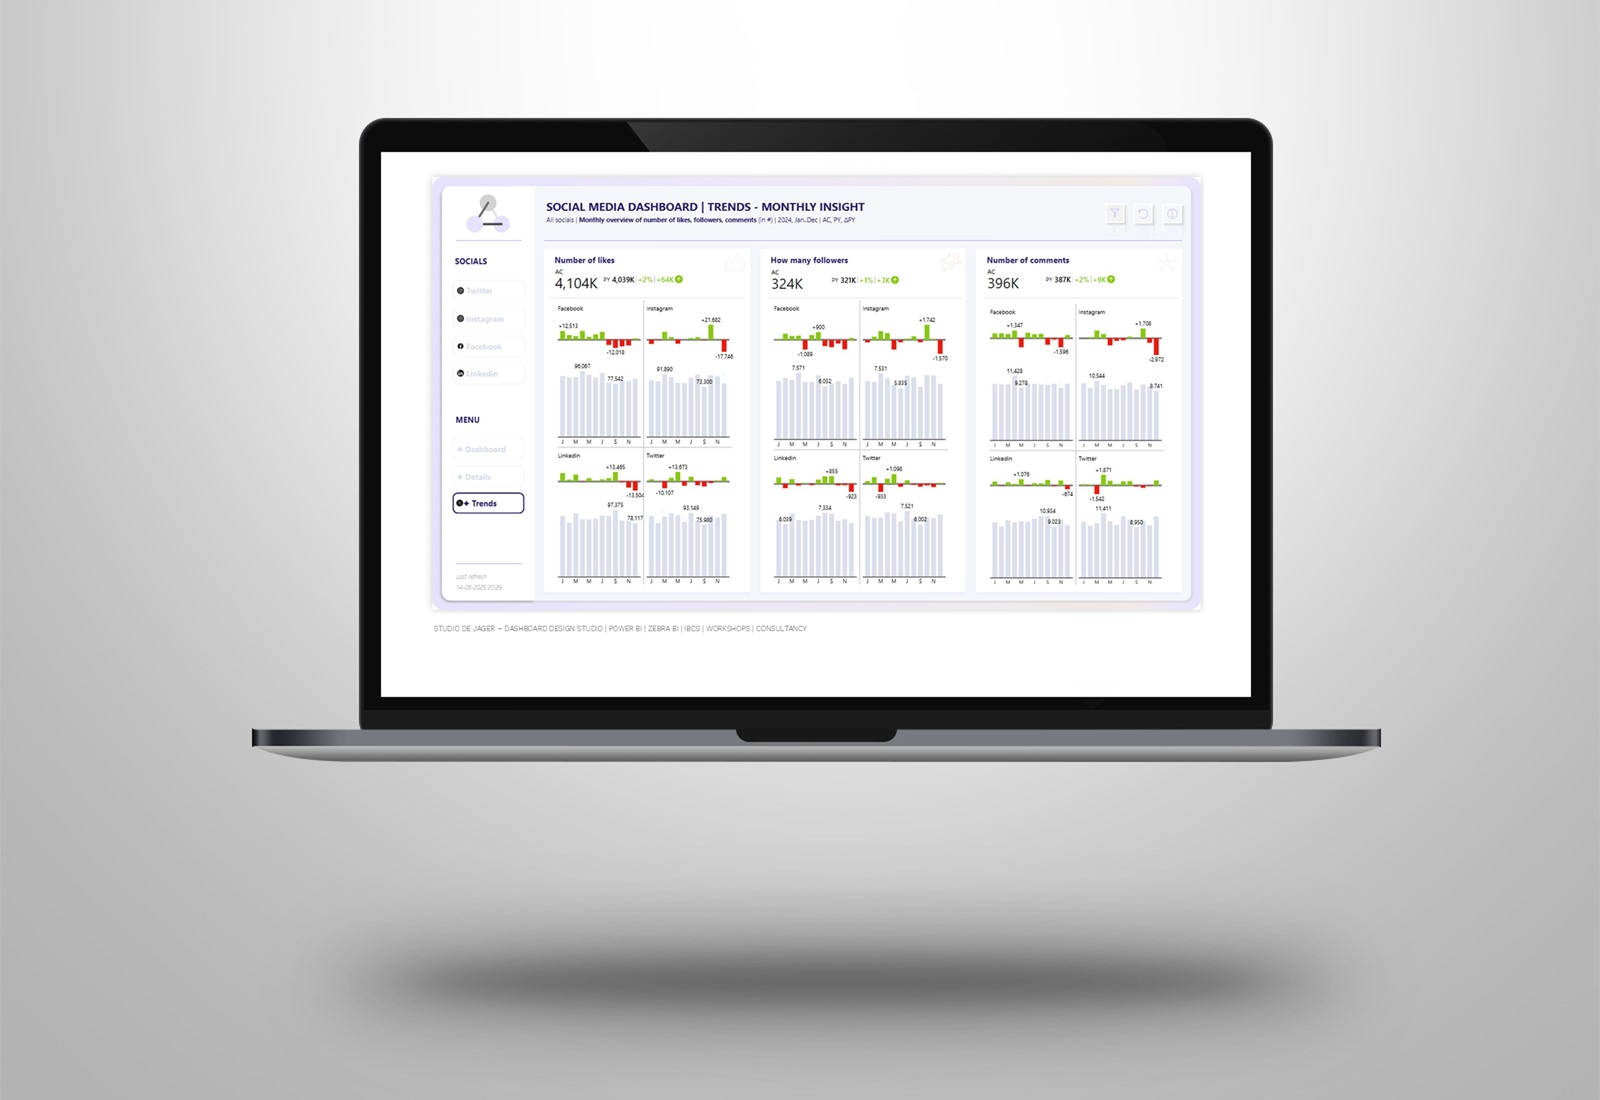
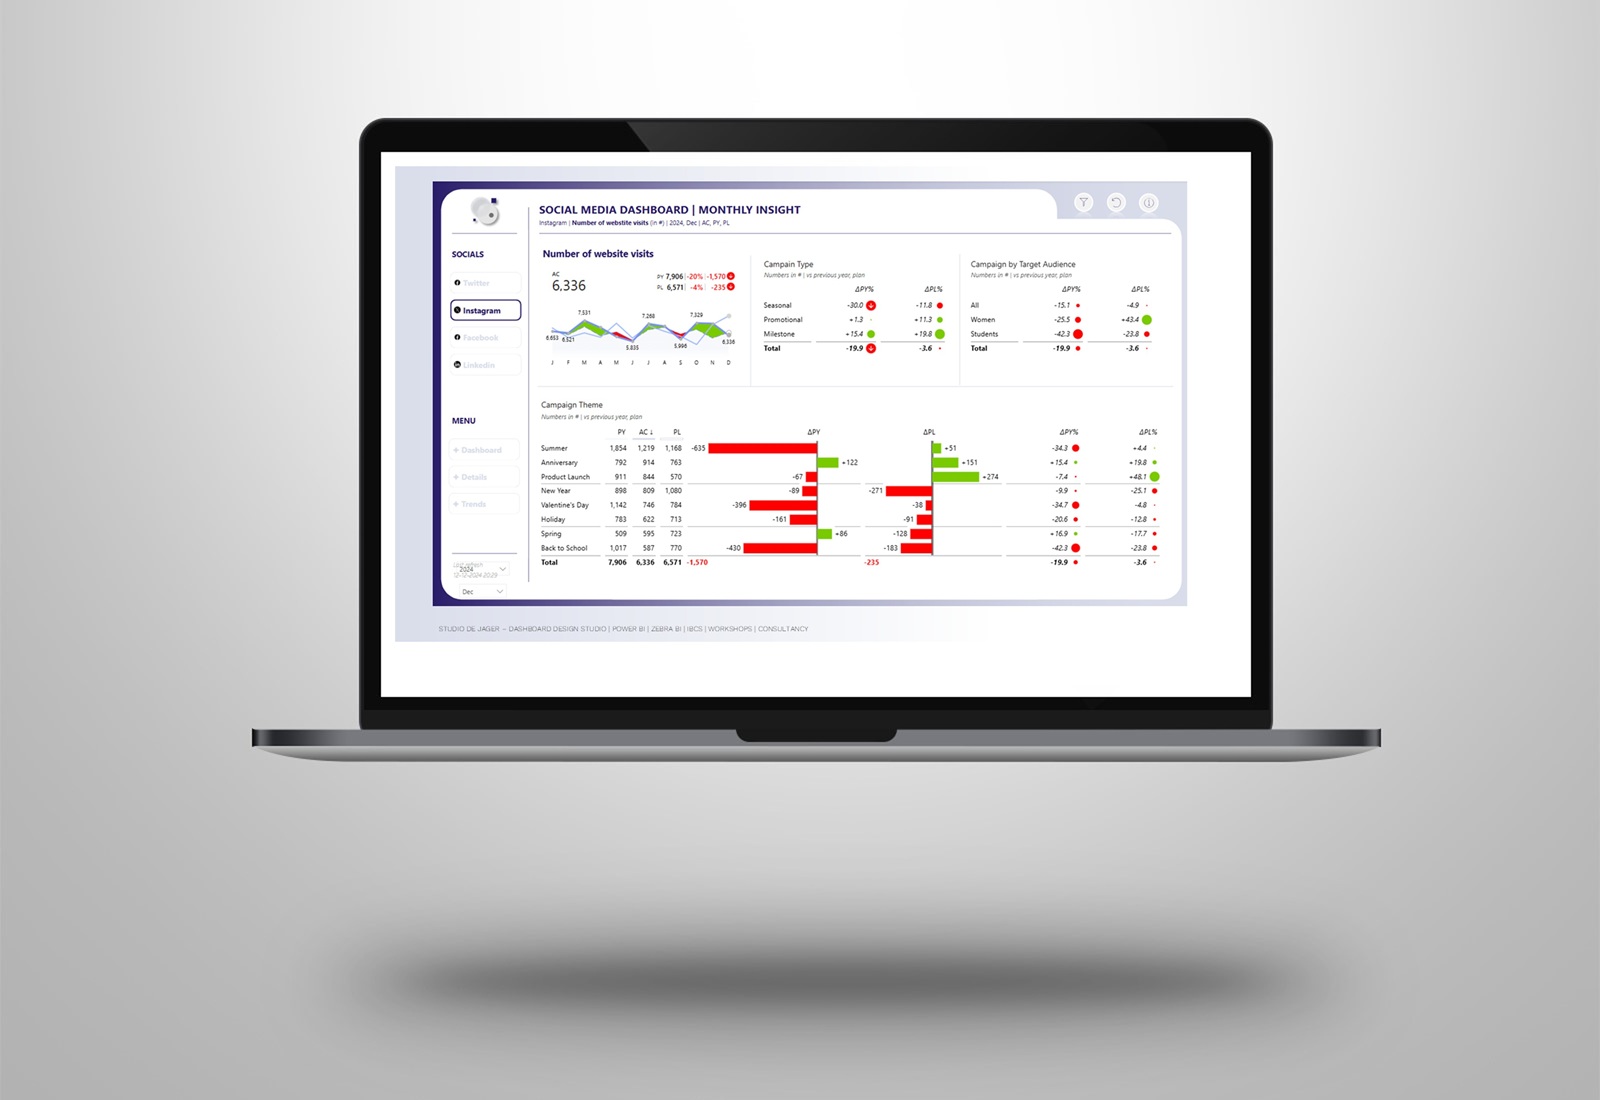
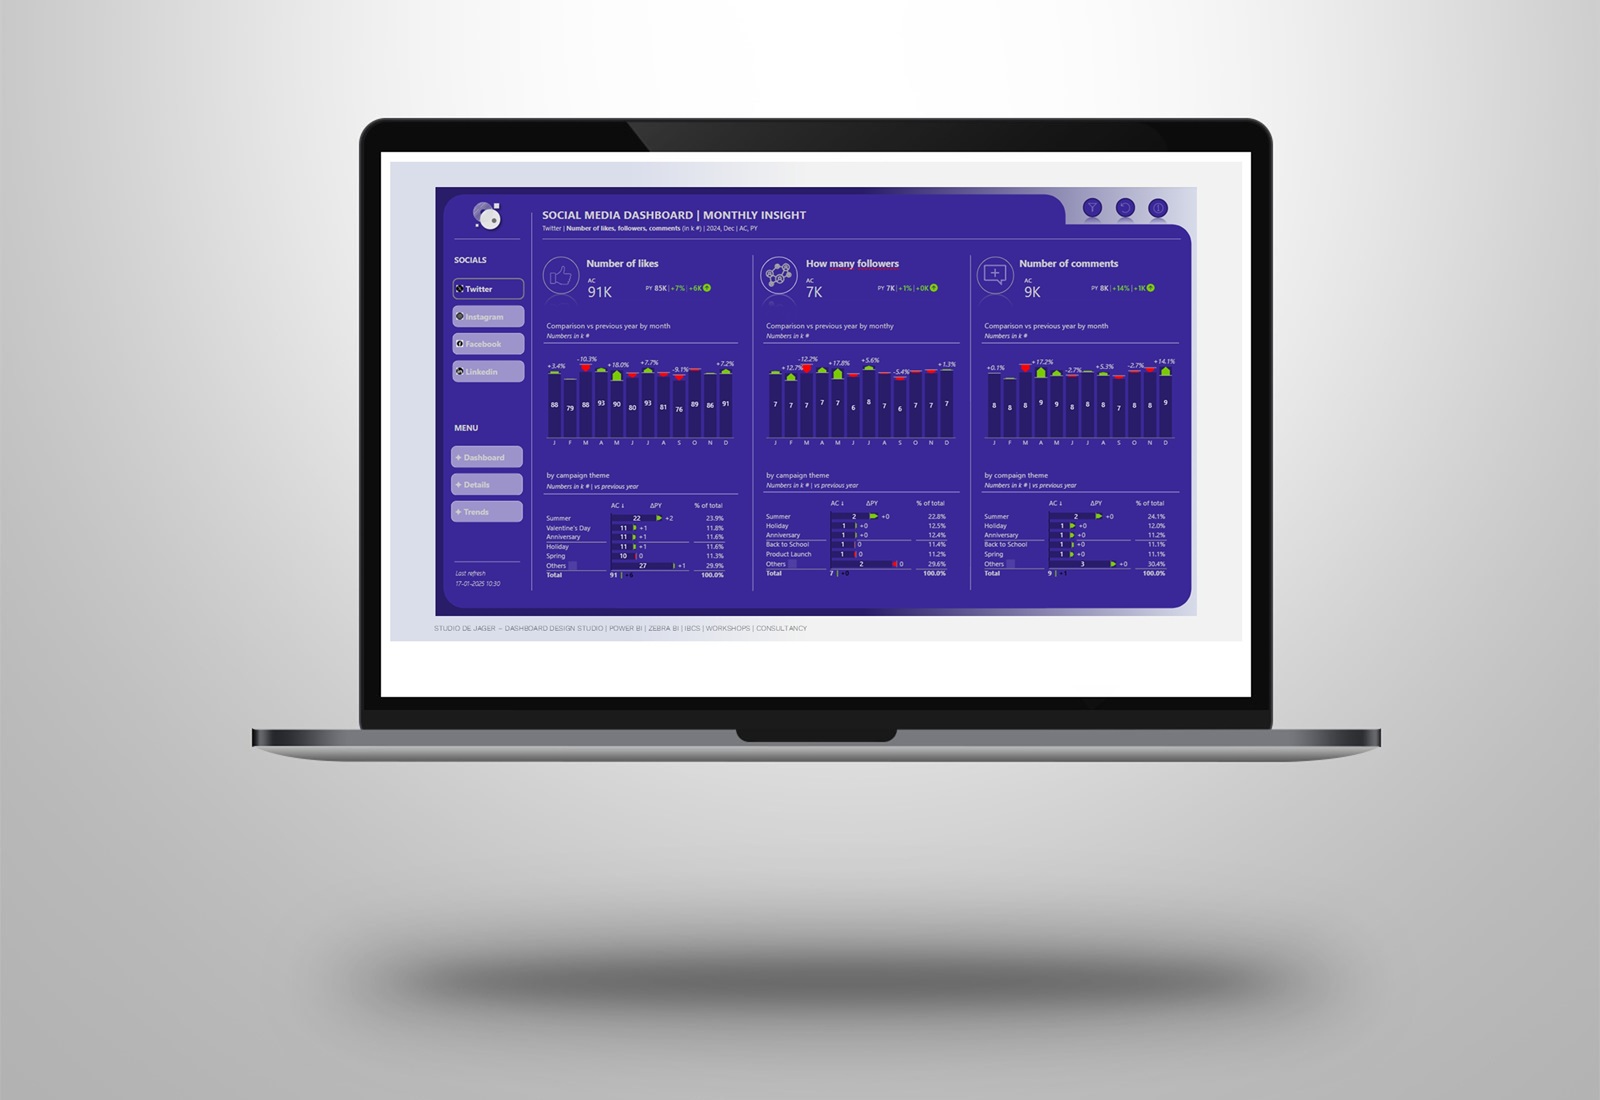
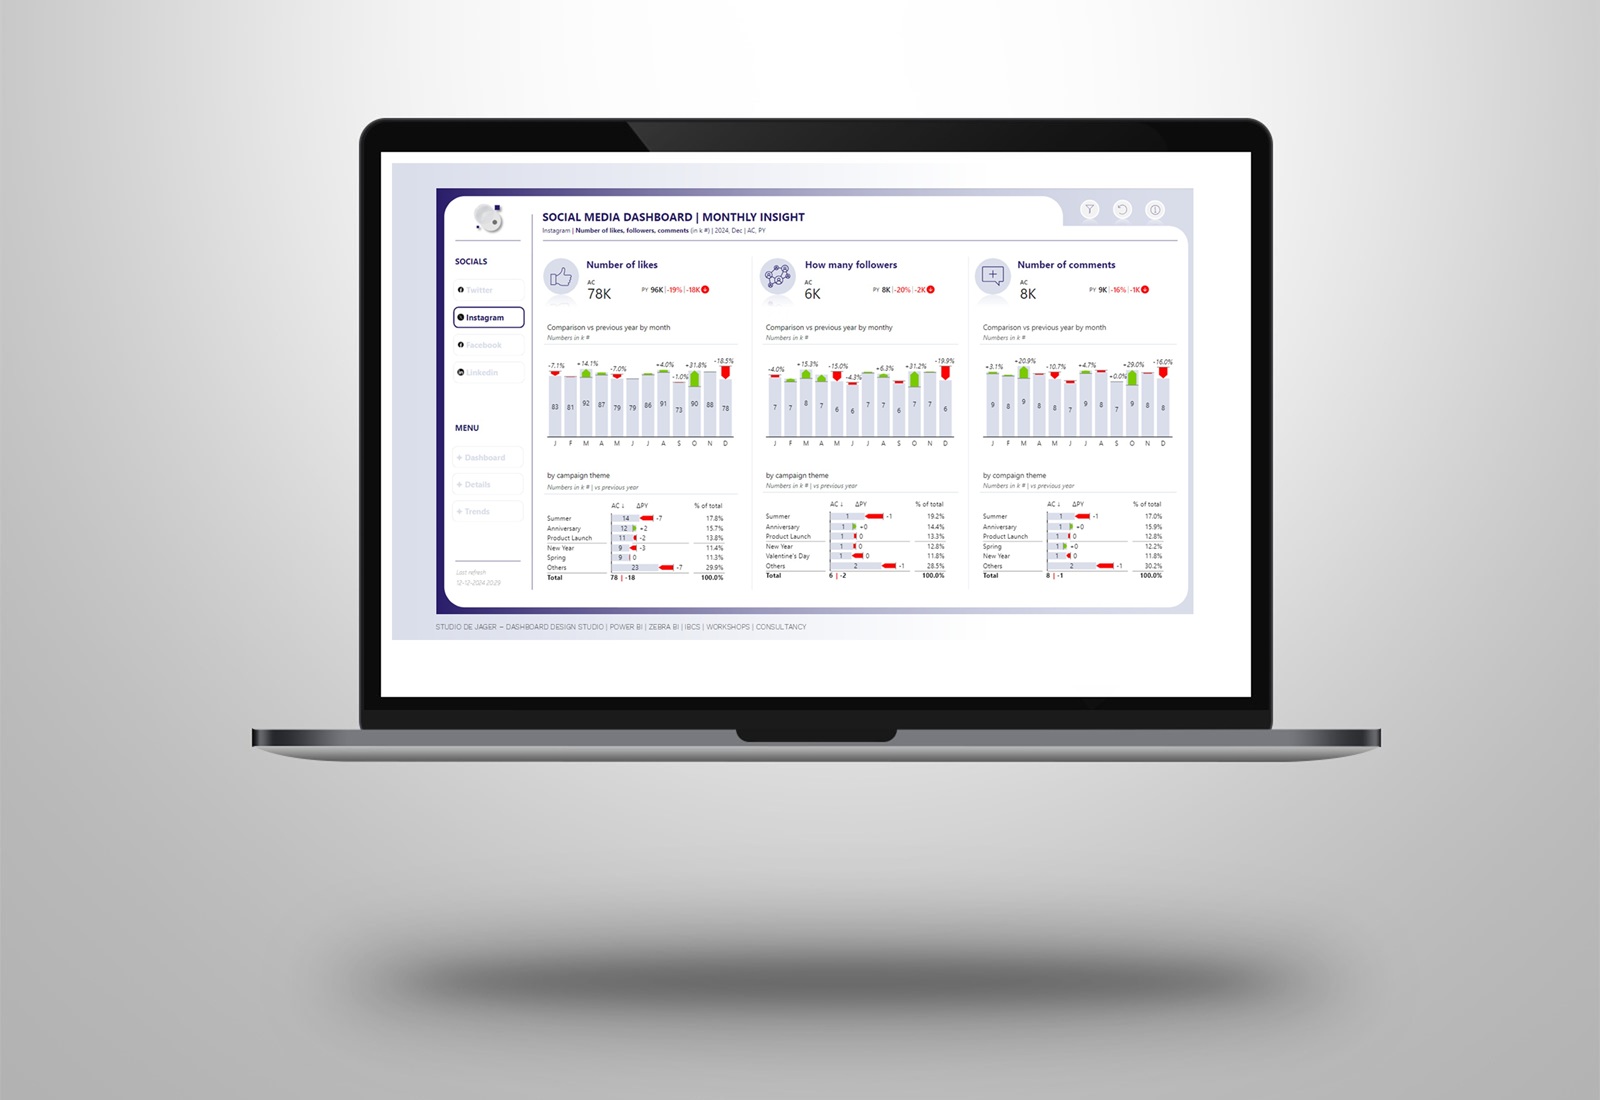
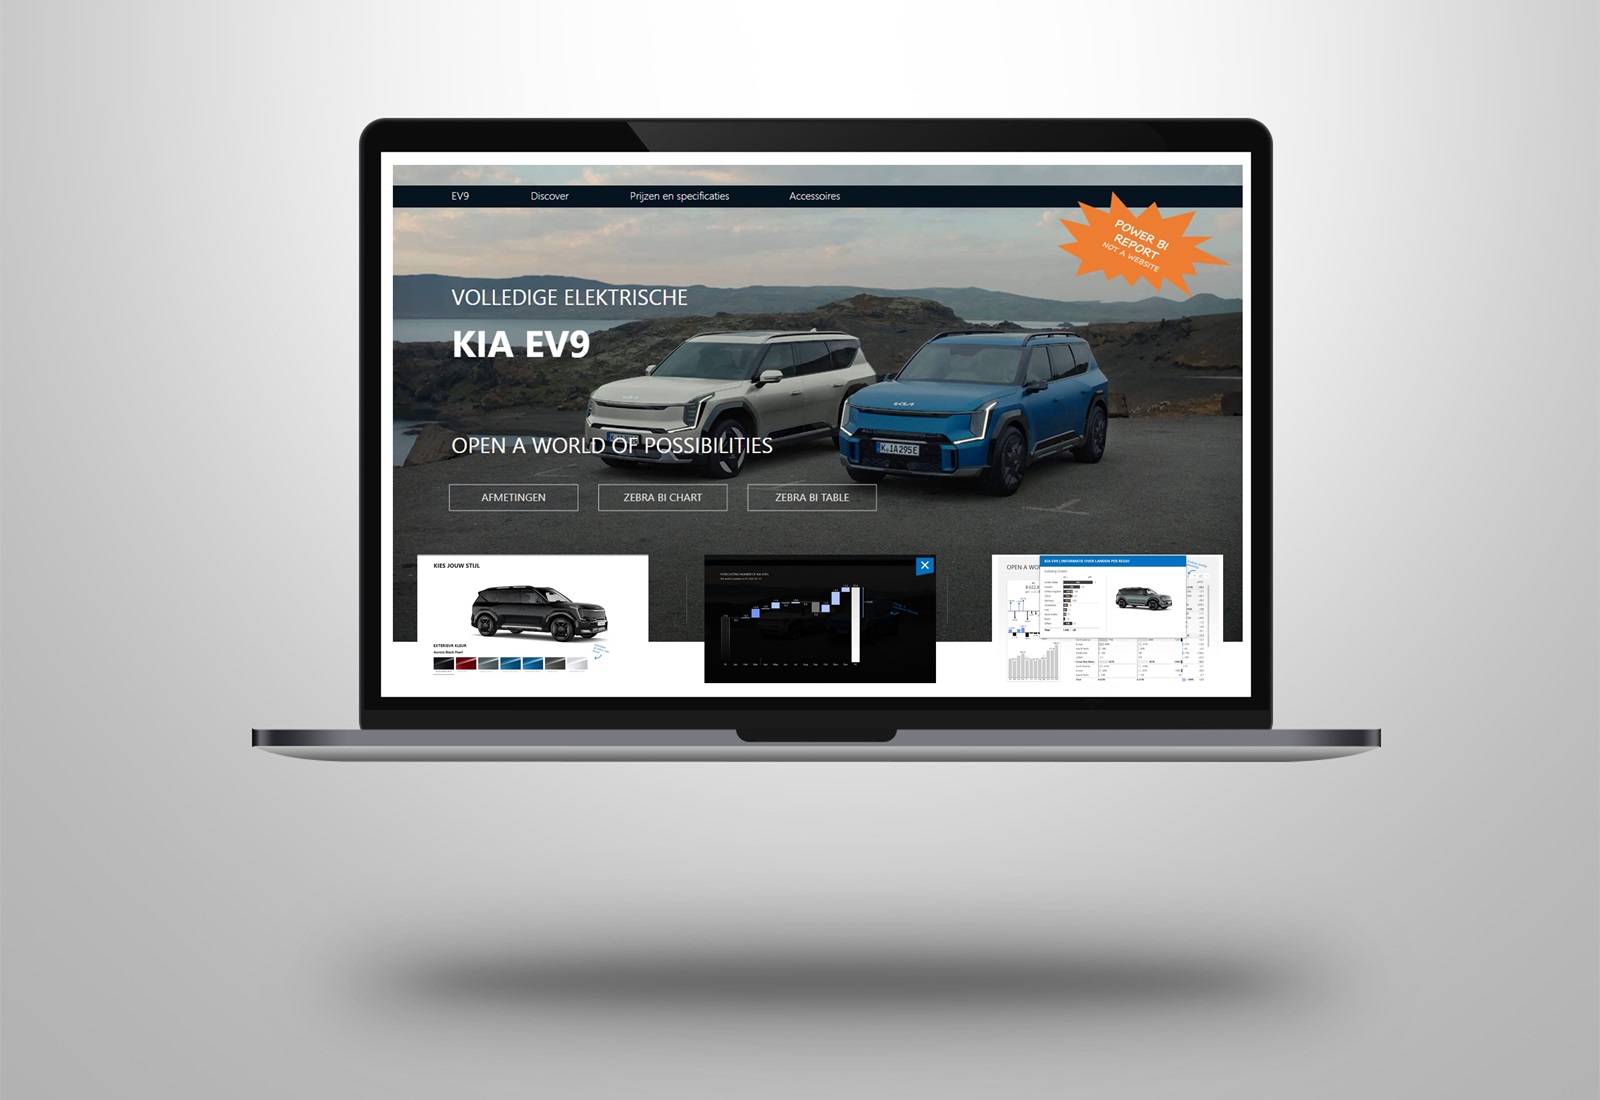
Take a look in my 𝐏𝐨𝐰𝐞𝐫 𝐁𝐈 report in which I created a nice UI design, as if it is a website.
Last month Microsoft released the 𝐧𝐞𝐰 𝐬𝐥𝐢𝐜𝐞𝐫𝐬 + 𝐜𝐚𝐫𝐝𝐬 and of course I had to test them. Because KIA recently launched their new model, the model EV9, I came up with the idea to make a Power BI report of the new KIA EV9.
𝐊𝐈𝐀 𝐫𝐞𝐩𝐨𝐫𝐭
◾ Used fake data in the report and used the colorblind-friendly design option in the Zebra BI BI visuals.
◾ Background design in PowerPoint.
◾ Custom page design in Power BI (XXL page format , canvas settings 2880 x 1280)
◾ Pictures and text is from KIA.com/nl/modellen/ev9
◾ The report consists of four sections. In all these sections I used a lot of the new slicers & cards.
◾ Section 1: New Slicer & Cards | Zebra BI chart & table visuals in colorblind friendly design | bookmarks
◾ Section 2: New Slicer & Cards
◾ Section 3: New Cards in Custom Tooltips | Zebra BI Card and Zebra BI table visuals in colorblind friendly design
◾ Section 4: New Slicers | bookmarks
📌 I think the new slicers + cards are a really good addition that gives you very cool new possibilities in Power BI. So all credits to the hashtagpbicorevisuals team, Miguel Myers & Armand van Amersfoort & others.
👍 Thanks to KIA for using the photos & info from their website (KIA). The KIA EV9 is a very special car!
Below the link to the video: https://lnkd.in/ev3zdv3S
Hope you like it !
Sasjah de Jager
Report & dashboard design | Official Zebra BI Partner | Power BI – Excel | IBCS Certified Analyst | Data visualization | Interim business consultancy