Many companies are still using PowerPoint for presenting their quarterly figures. For the people behind this presentation, it cost a lot of manual work to create it, a lot of copy and pasting. So why not use Microsoft Power BI for these presentations? Last time I’ve made a T-Mobile deck presentation, but I >> Lees verder
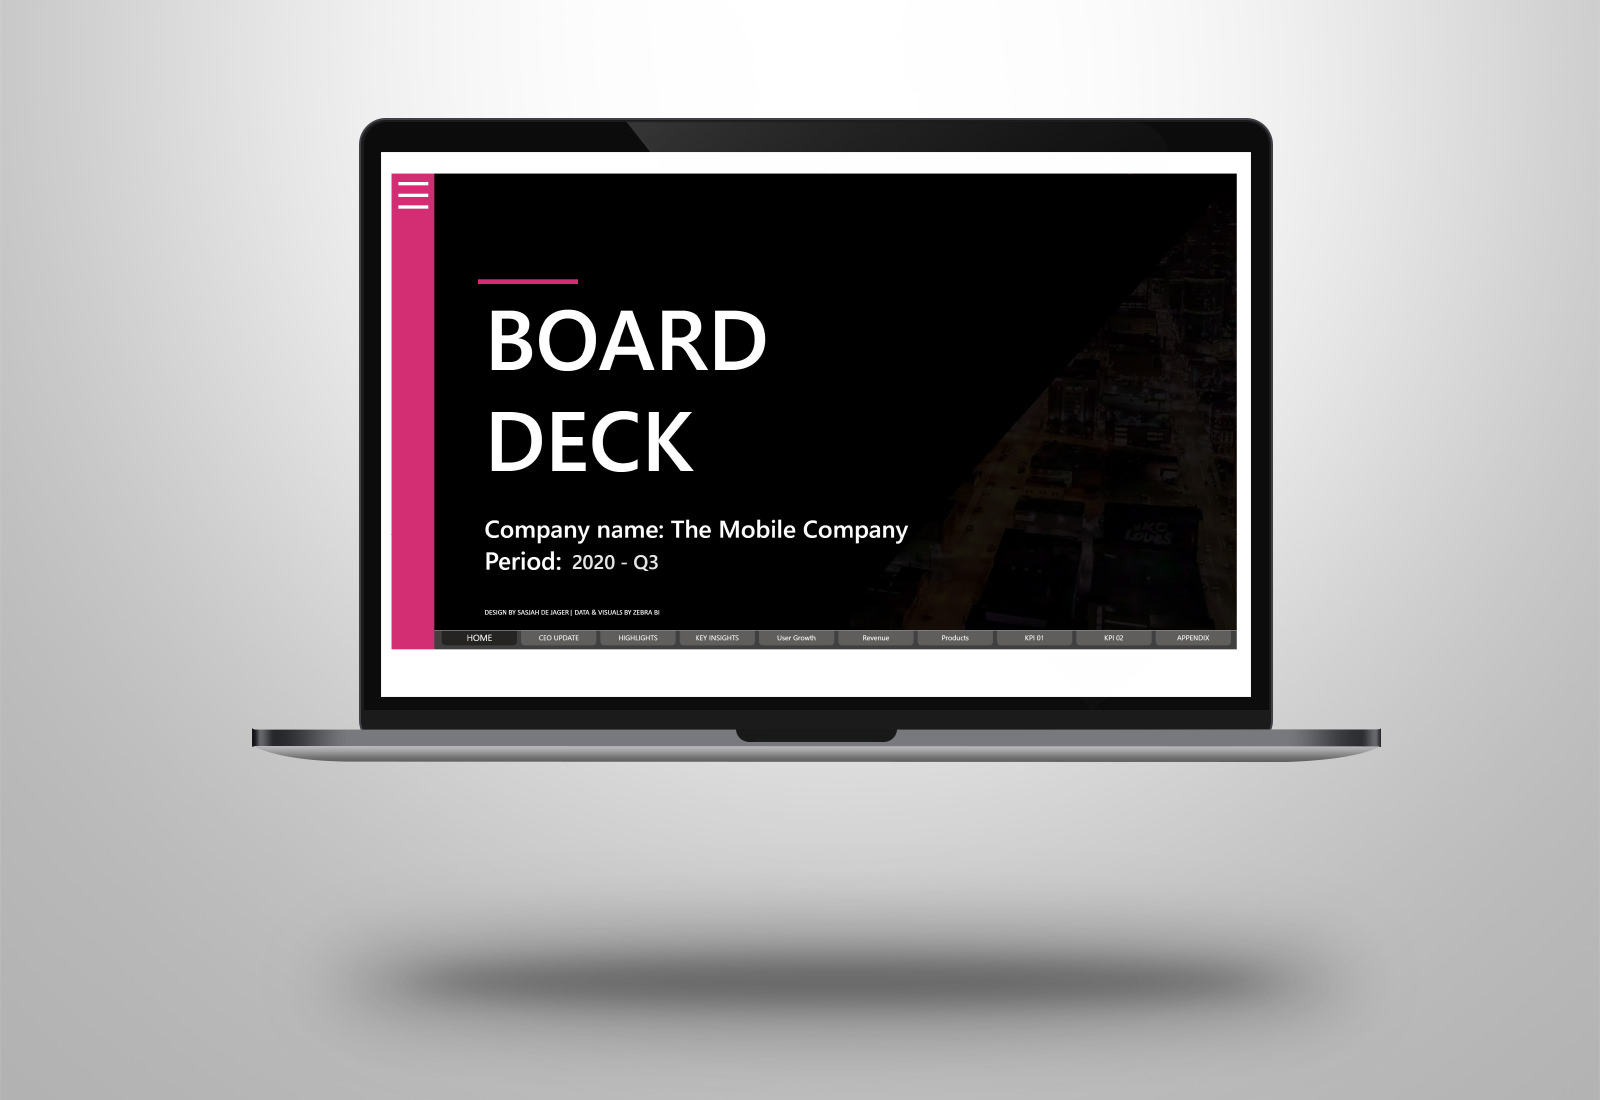
Power BI | Board Deck presentation with a T-Mobile design
kaboem2024-05-24T09:02:18+02:00Many companies are still using PowerPoint for presenting their (quarterly) figures. For the people behind this presentation, it cost a lot of manual work to create it, a lot of copy and pasting. So why not use Microsoft Power BI for this kind of presentations? I thought it would be fun to make >> Lees verder
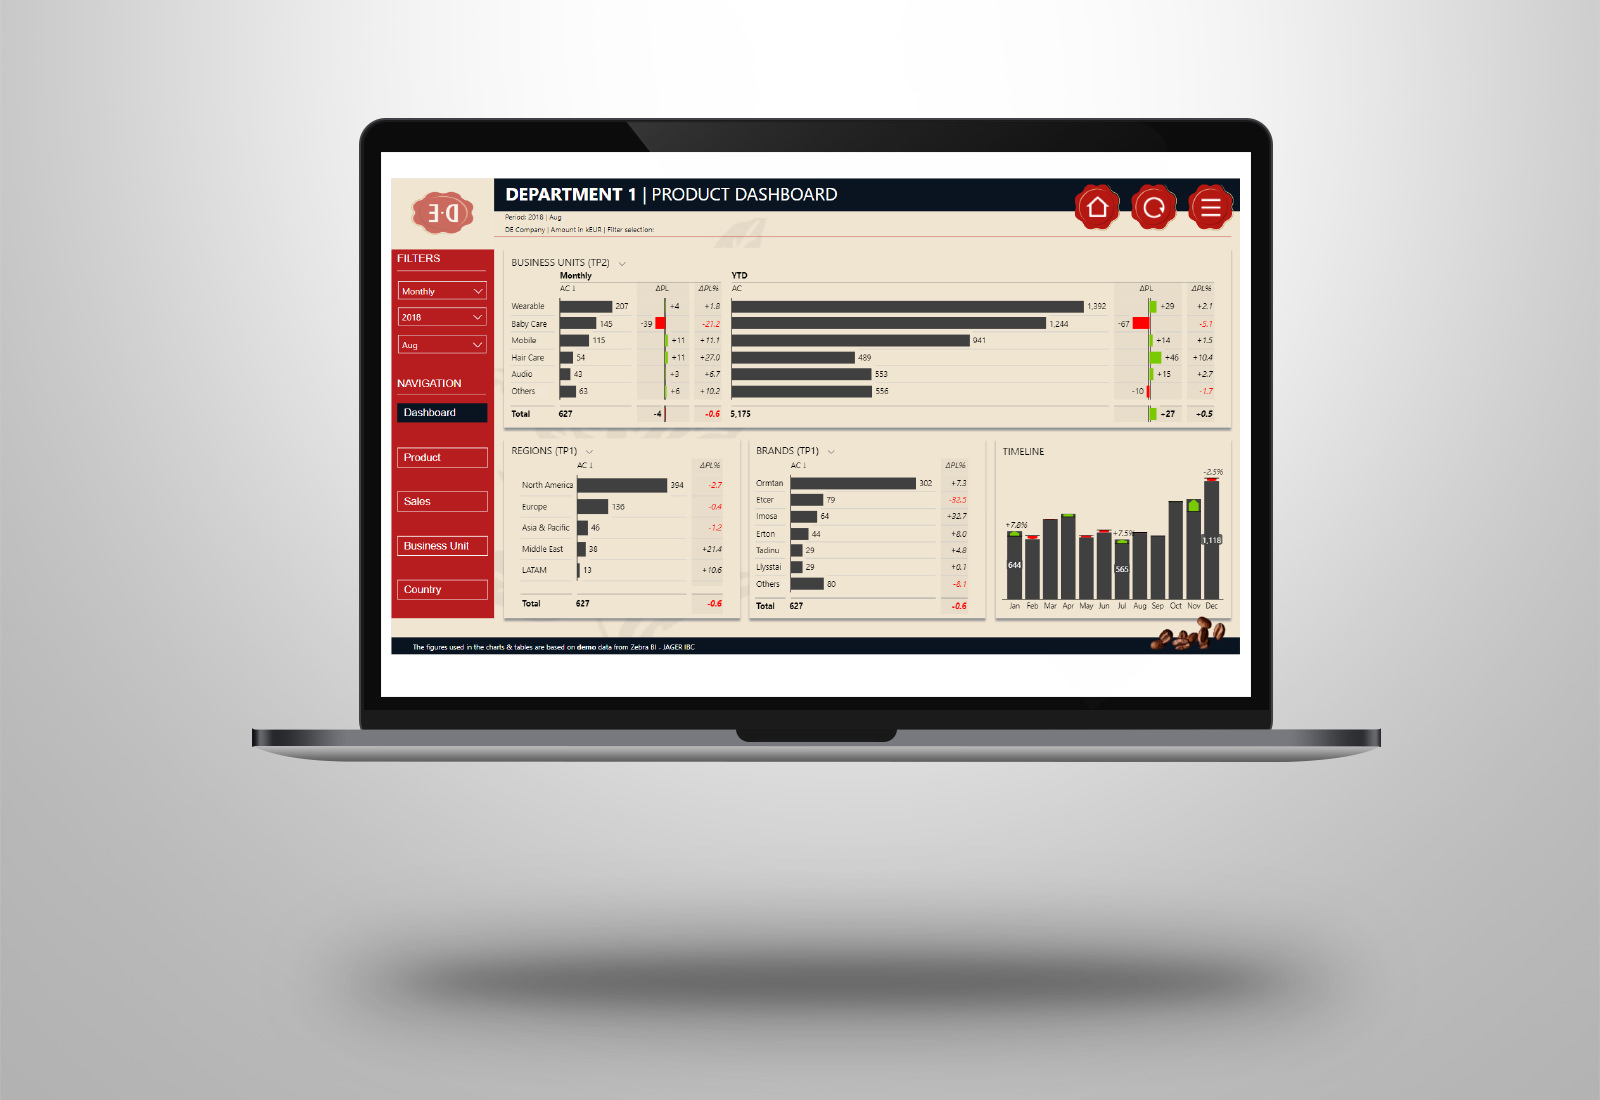
Power BI | dashboard with a Douwe Egberts taste
kaboem2024-05-24T09:02:59+02:00Many people are working at home during the corona period. One of the advantages of this is that we can choose our own favorite coffee. I like to drink coffee of Douwe Egberts. I thought it would be fun to make a Douwe Egberts Power BI sales dashboard. Coffee & Microsoft Power BI, >> Lees verder
Power BI | dashboard with a Milka taste
kaboem2022-03-23T10:03:53+01:00our expertise Characteristic of Milka is not only the delicious taste of their chocolate but of course also the purple cow, who doesn’t know it.I thought it would be fun to make a Milka dashboard because of the beautiful colors of this brand and ..... naturally …… the cow...... In the dashboard I used >> Lees verder
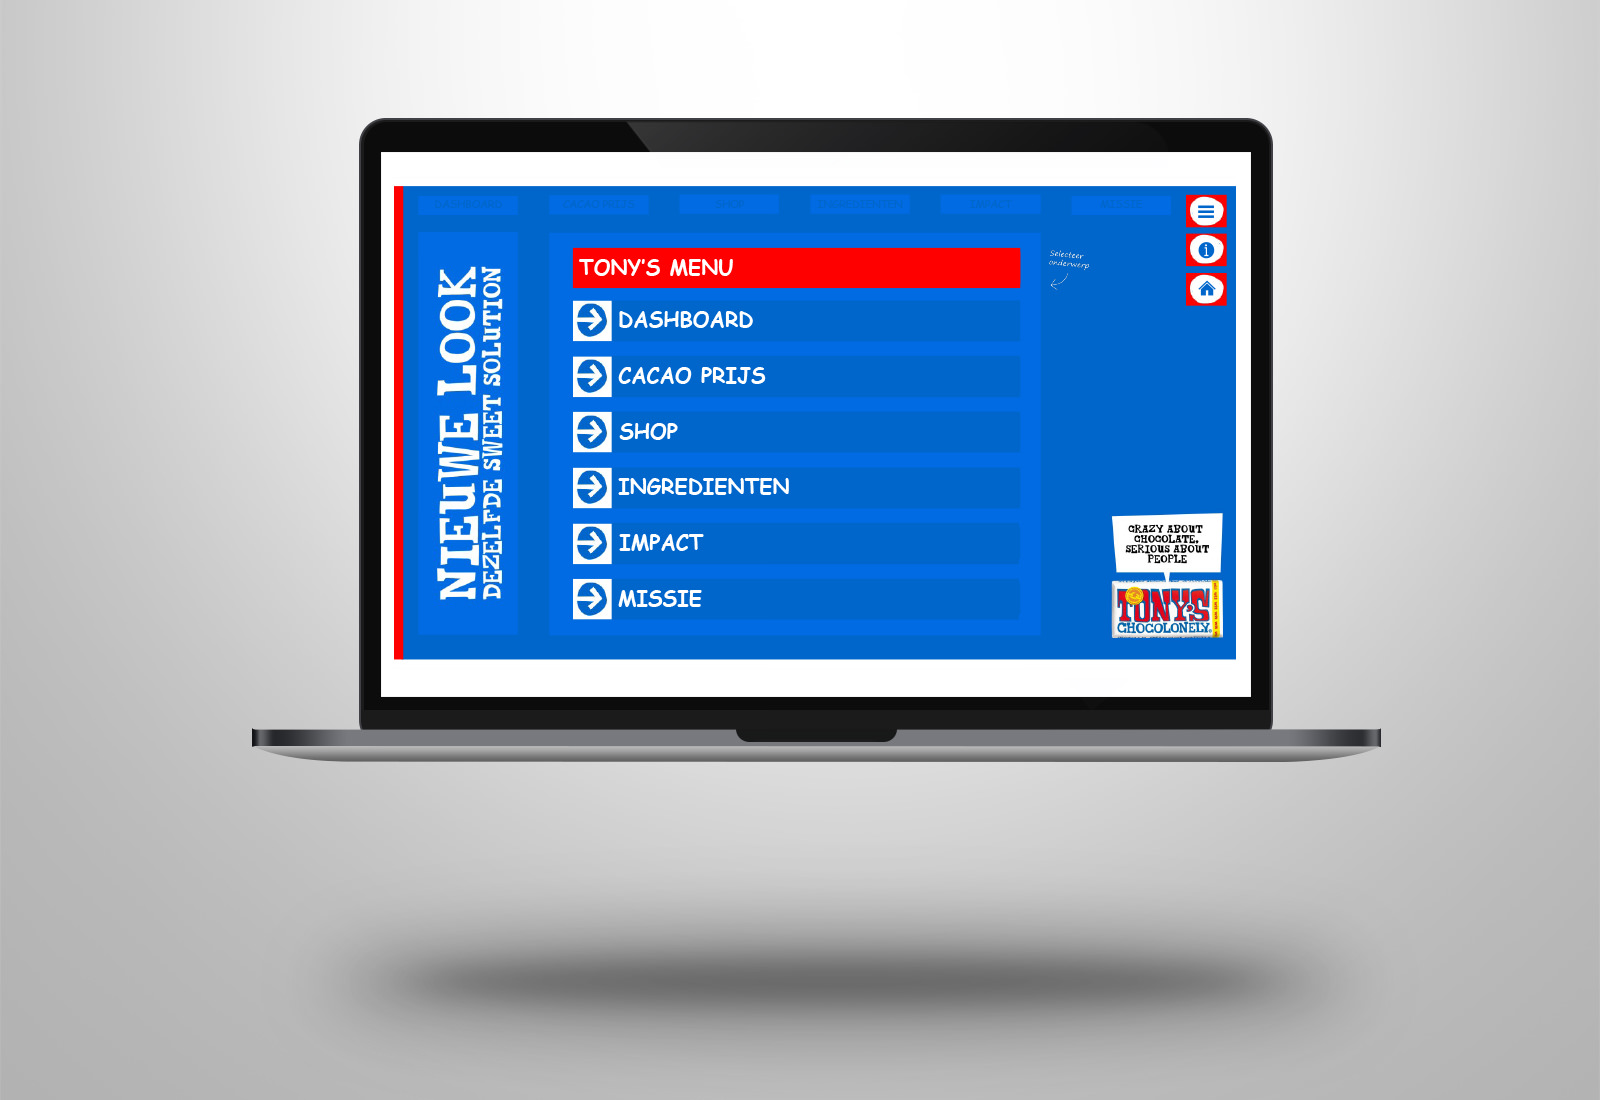
Power BI | Tony’s Chocolonely dashboard
kaboem2022-03-23T10:28:33+01:00our expertise All chocolate 100% slave free. Worldwide. That's the mission of Tony's Chocolonely. On 1 October, the Government of Côte d'Ivoire announced that the new farmgate price for this harvest season will fall by 18.5%. Really not okay! Without compensation from the big chocolate companies, this leads to an increase in the >> Lees verder
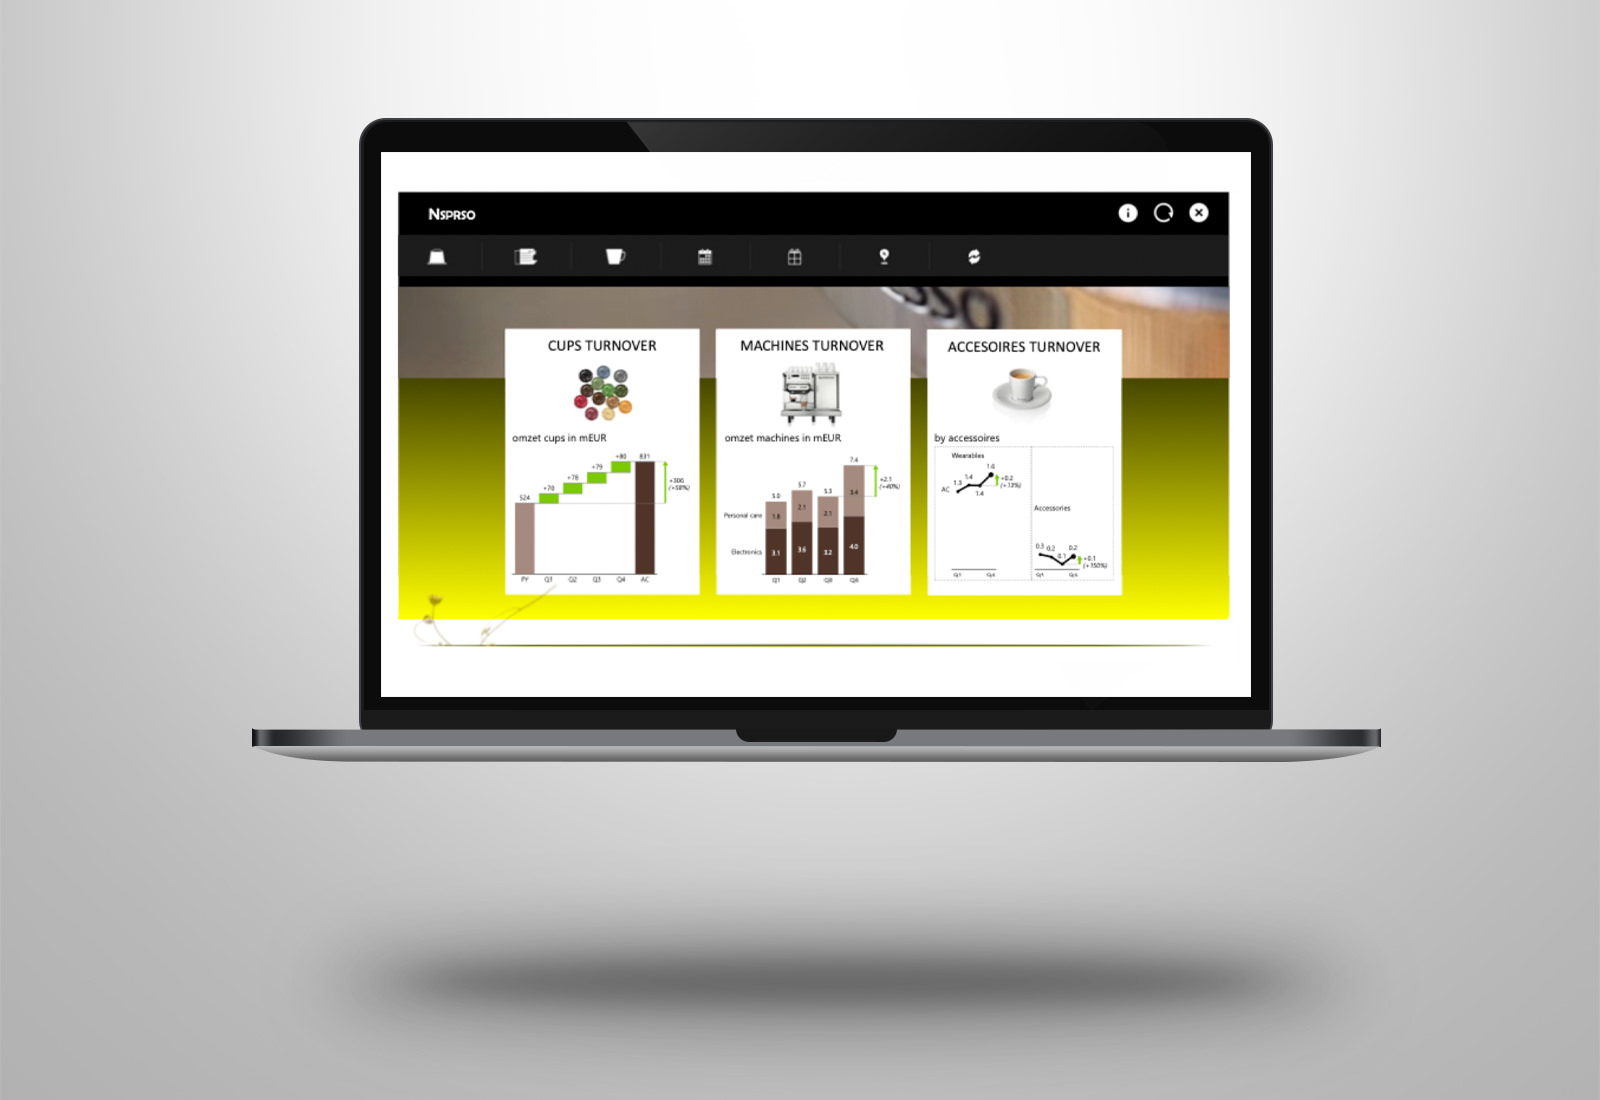
Power BI | Nespresso coffee dashboard
kaboem2022-03-23T10:21:43+01:00our expertise How do you drink your coffee? Many people are working at home during the corona period. One of the advantages of this is that we can choose our own coffee. I like to drink the coffee of Nespresso and have a preference for the espressos. So I thought it would be >> Lees verder
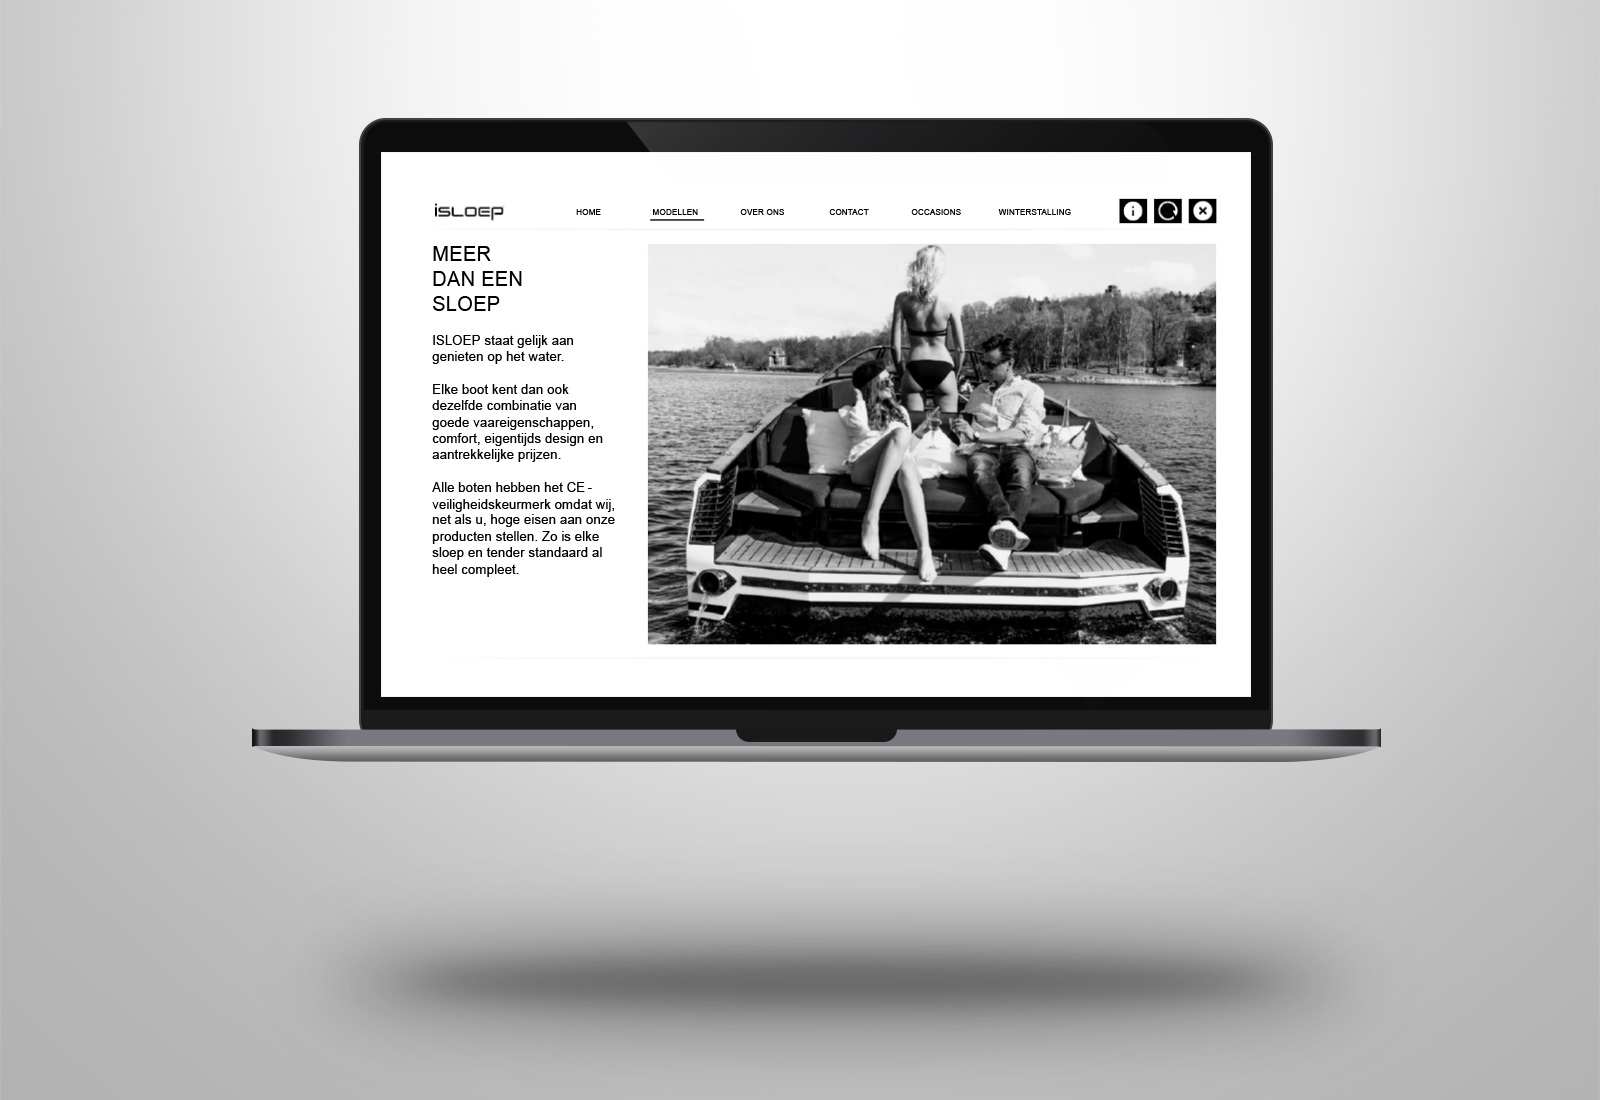
Power BI | Isloep dashboard
kaboem2022-03-23T10:21:16+01:00our expertise During the summer period I’d like to spent a lot of time on my boat with my family and friends. We always have fun and sailing with the boot gives a lot of relaxation. My personal favorite, the isloep 735 ! Recently Zebra BI released the last update before the summer >> Lees verder
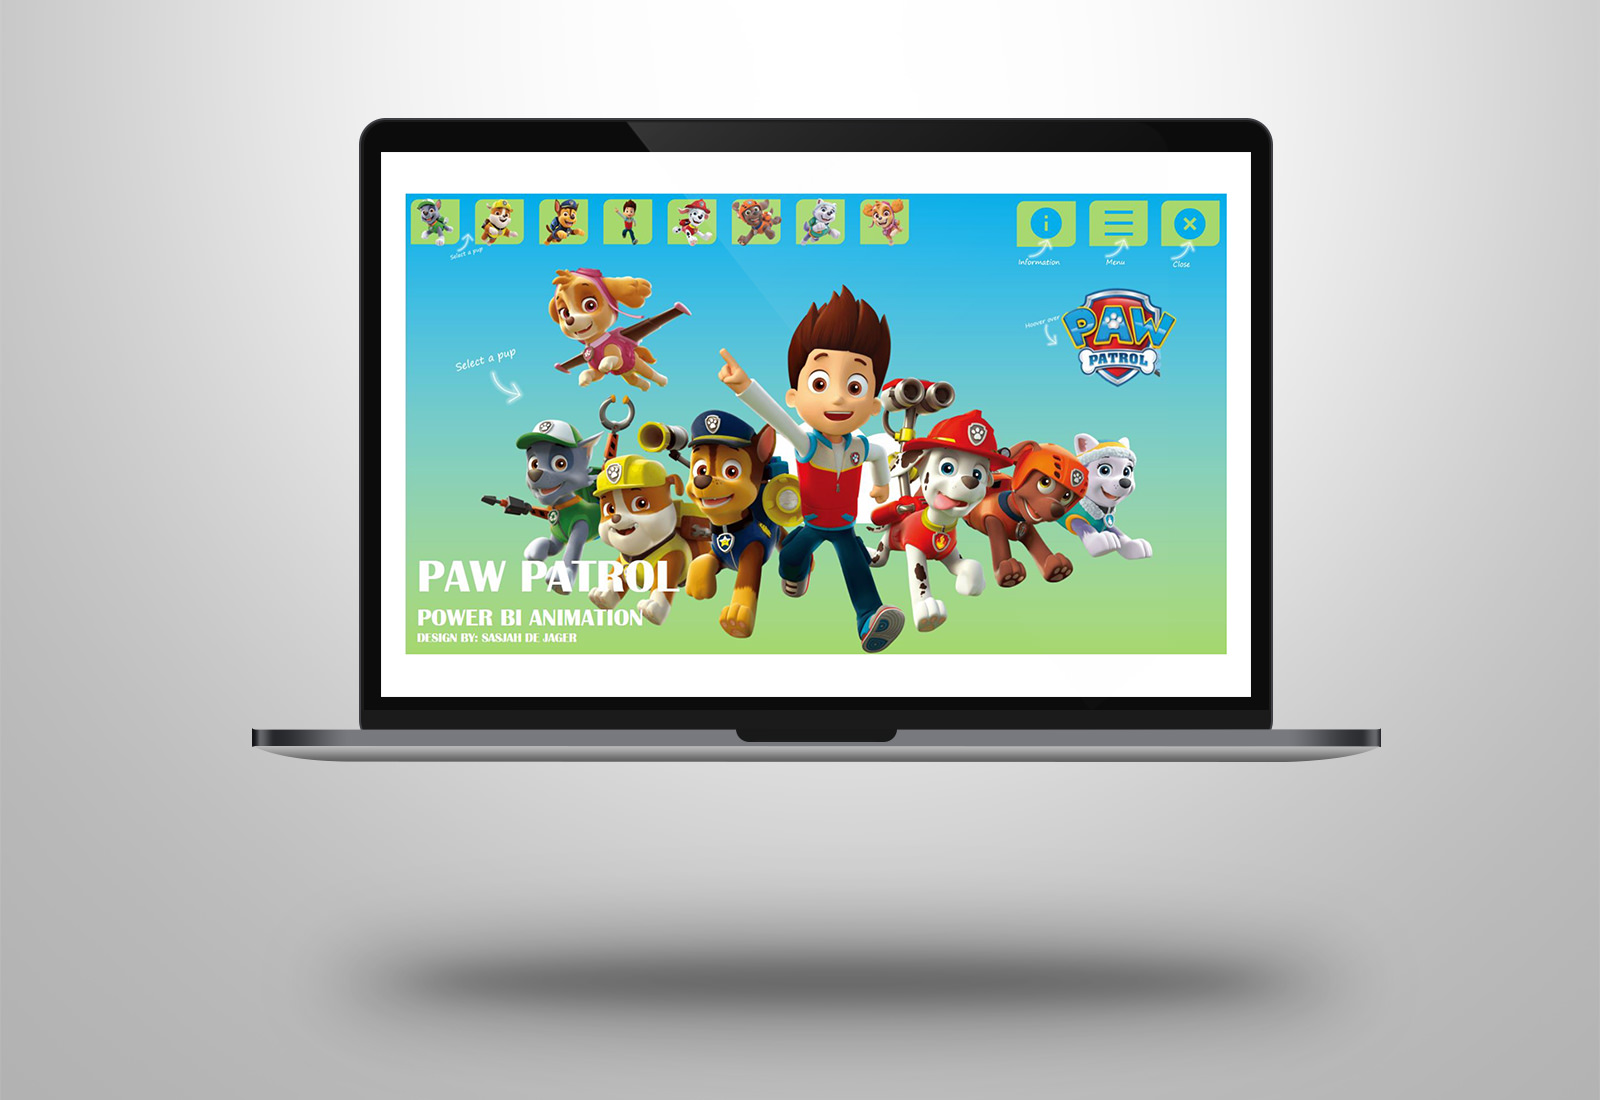
Power BI | Paw Patrol dashboard animation
kaboem2021-06-29T14:42:13+02:00our expertise This week something totally different, no business report in Power BI. Inspired by earlier work of Armand van Amersfoort (Horse Power BI) I decided to make an animation in Microsoft Power BI. I asked my little daughter Evy (5 years old) for the subject. She is a very big fan of >> Lees verder
Power BI | UI design dashboard The Impact Group
kaboem2021-06-29T14:34:29+02:00our expertise Vorige week heb ik voor Pieter van Velze en zijn team van The Impact Group een leuke kennis sessie verzorgt over de ontwikkeling op het gebied van business reporting. Gesproken over IBCS – International Business Communication Standards, Zebra BI en Microsoft Power BI. The Impact Group is een full service recruitment >> Lees verder
Power BI | UI design a la Desperados beer
Sasja Jager, de2021-06-29T14:19:38+02:00our expertise I already published the UI designed Power BI reports of Birra Moretti and Corona beer. The last of this “beer episode” should be Desperados. This is because I really like the design, every flavor has its own design identity. I thought it would be super fun to build a Microsoft Power BI >> Lees verder
