Power BI | Action dots are here - a must have for your dashboards
Effective dashboards go beyond aesthetics as they combine UX/UI design with 𝐚𝐜𝐭𝐢𝐨𝐧𝐚𝐛𝐥𝐞 𝐢𝐧𝐬𝐢𝐠𝐡𝐭𝐬 to drive decisions. Zebra BI latest product update brings an innovative way to 𝐯𝐢𝐬𝐮𝐚𝐥𝐢𝐳𝐞 𝐯𝐚𝐫𝐢𝐚𝐧𝐜𝐞𝐬 with Action dots.
Action dots transform raw numbers into clear, visual insights, making variance tracking more 𝐢𝐧𝐭𝐮𝐢𝐭𝐢𝐯𝐞 𝐚𝐧𝐝 𝐞𝐟𝐟𝐢𝐜𝐢𝐞𝐧𝐭, especially for dashboards where space is tight.
✅ Smart sizing – The combination of size and color makes it easy to spot over- and underperformance at a glance.
✅ Space-efficient & intuitive – A simple, effective way to track performance.
✅ Designed for action – Identify risks and make better decisions—faster.
𝐄𝐱𝐚𝐦𝐩𝐥𝐞
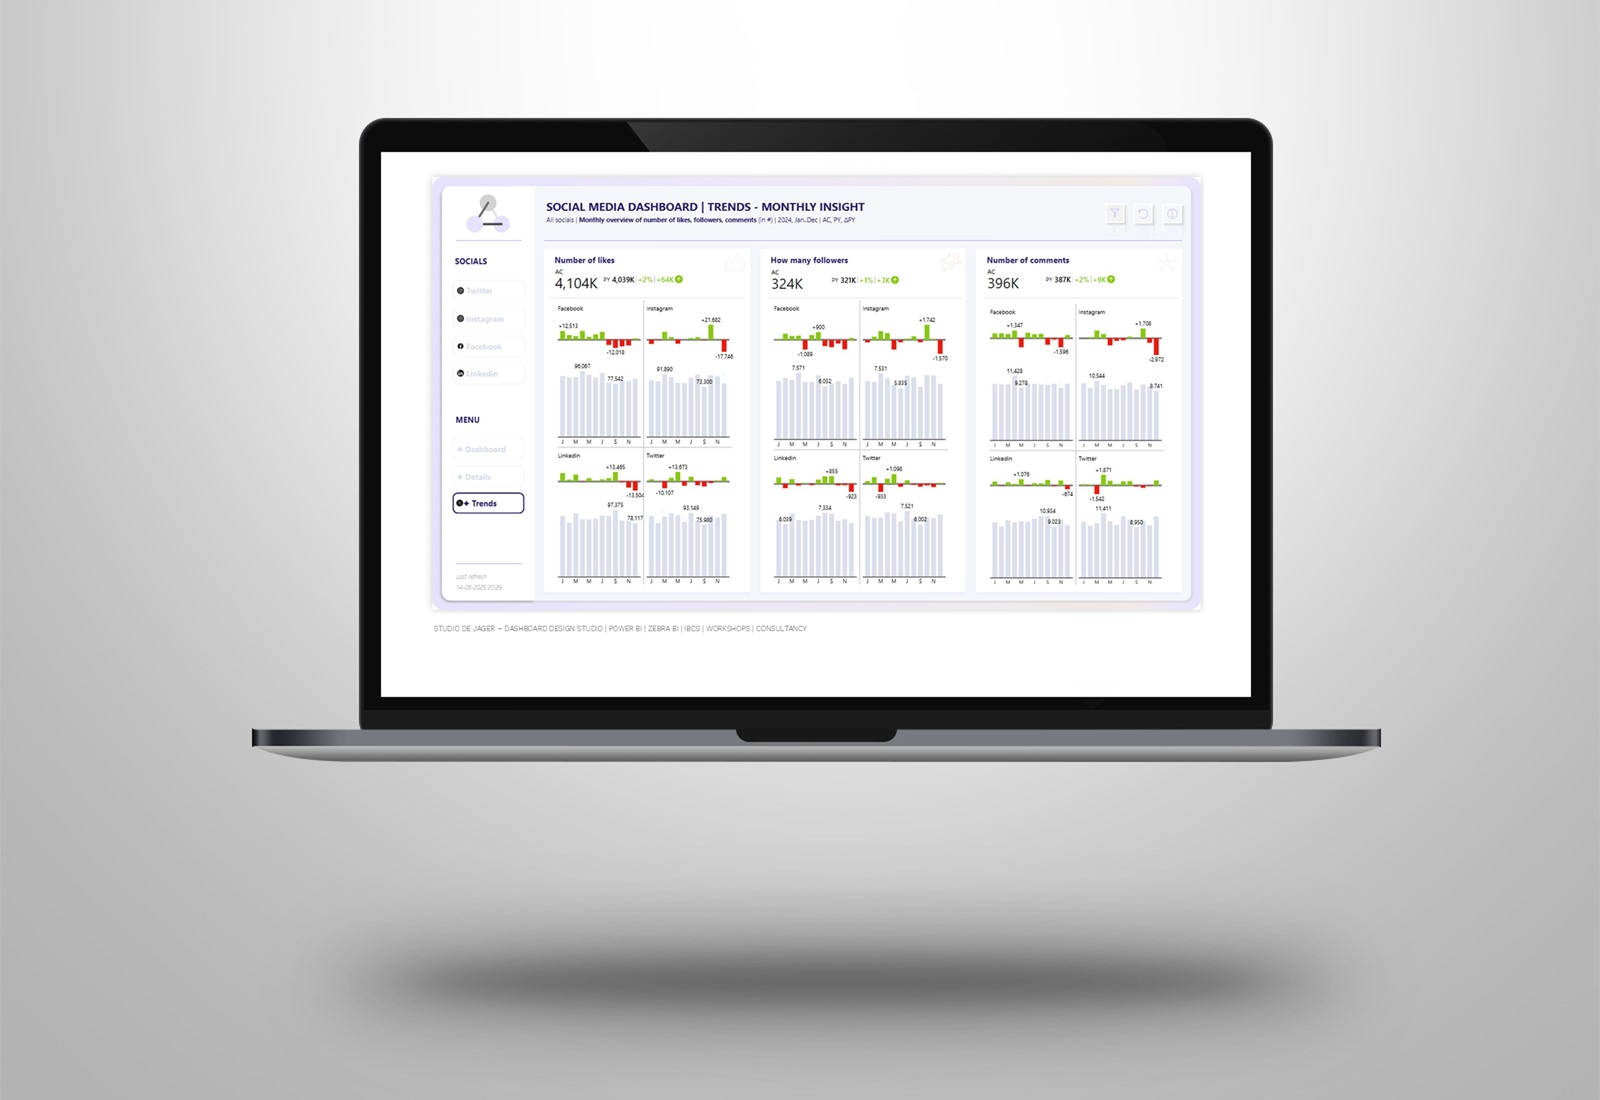
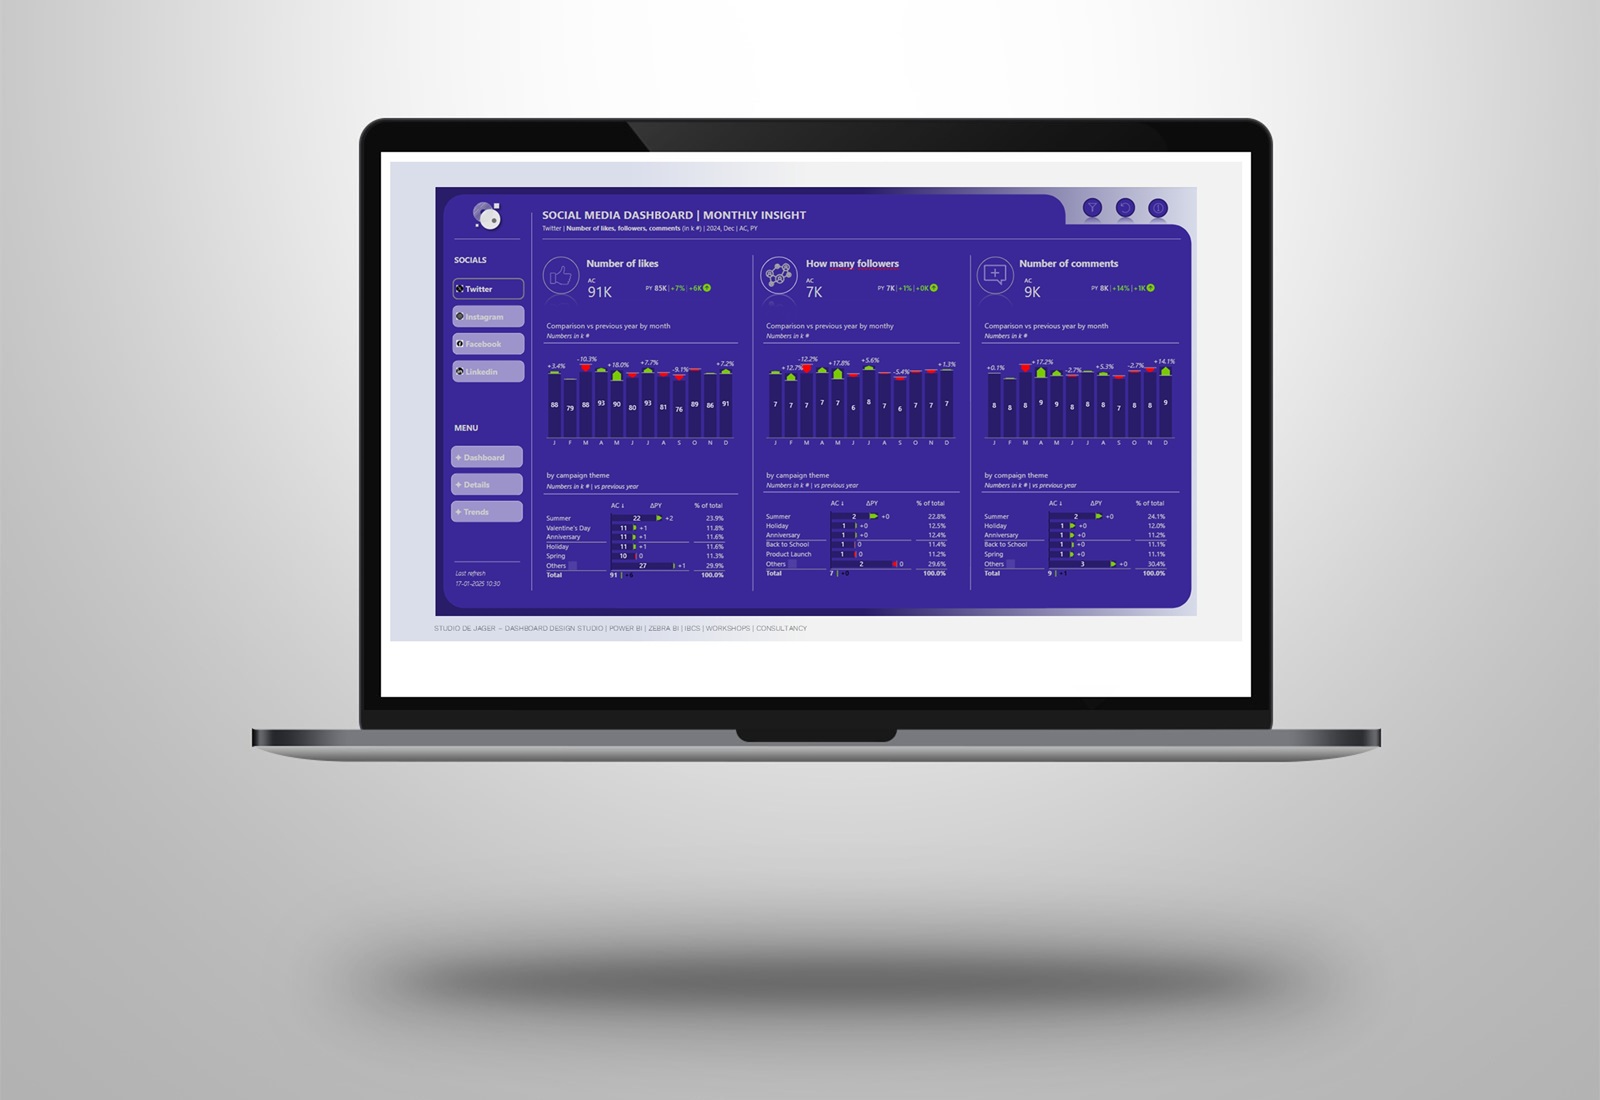
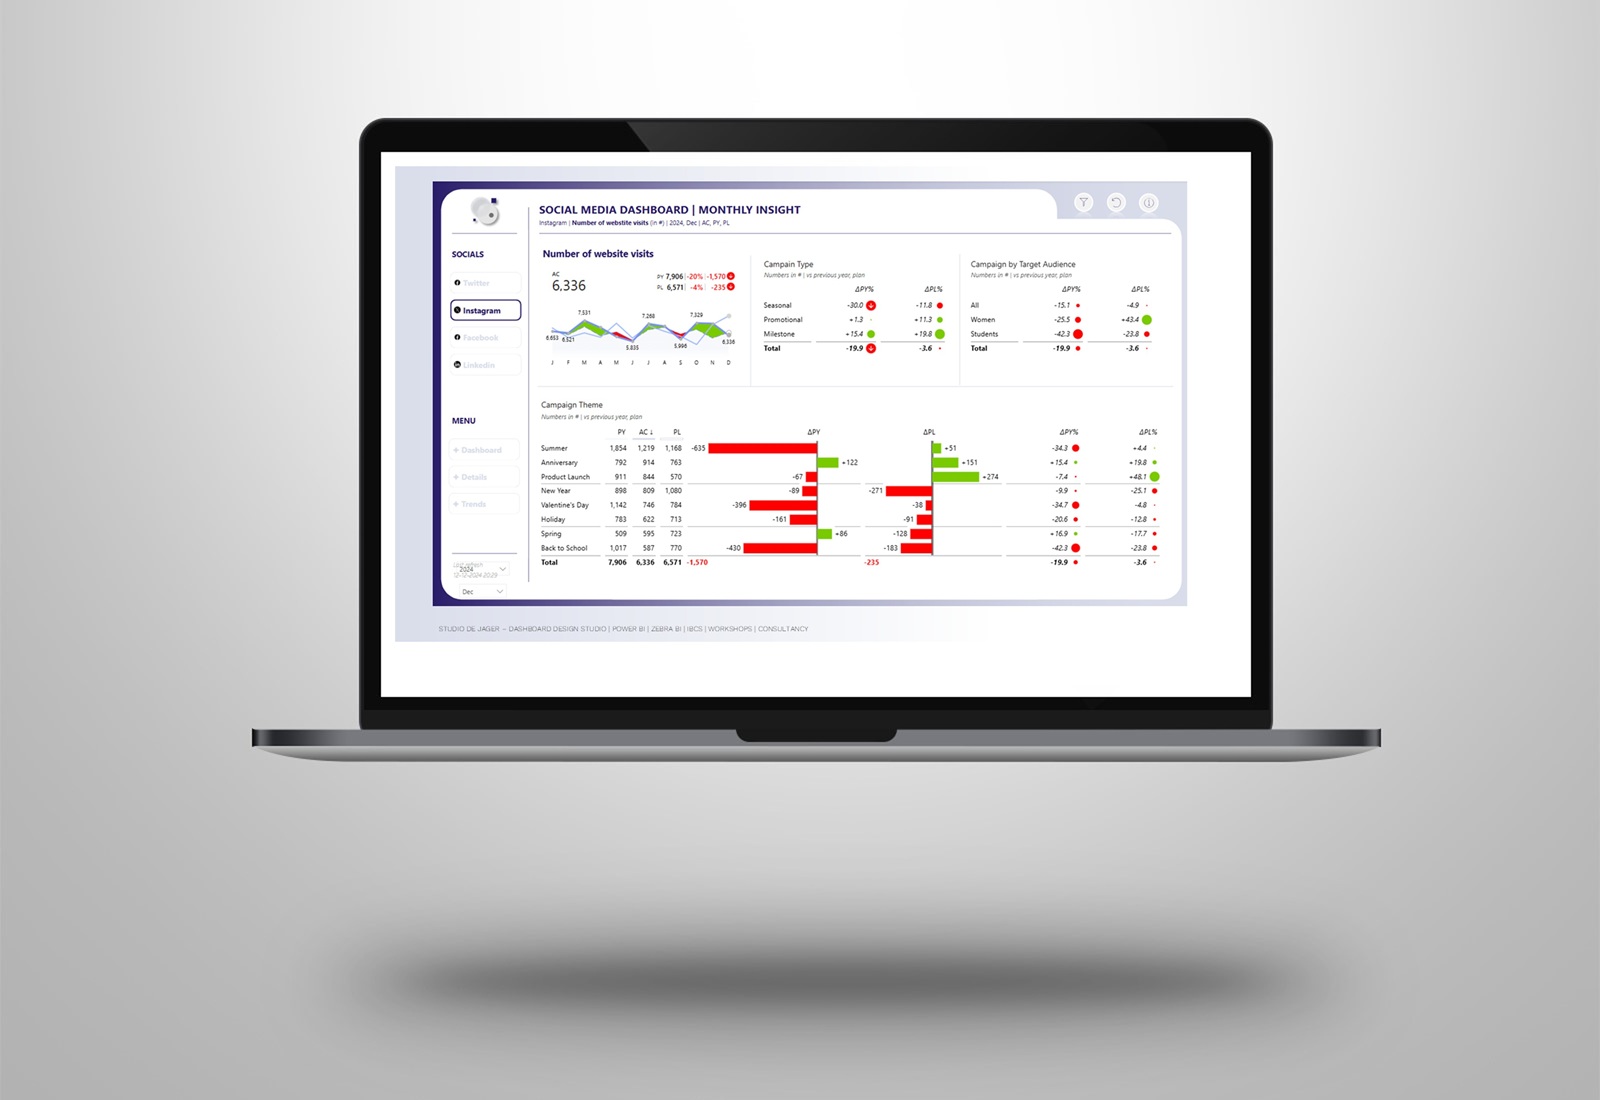
In the example I’m sharing (with demo data of Zebra BI), I’ll show how you can create a dashboard with the action dots. Two different ways to present the action dots.
✅ First example the standard way to use them.
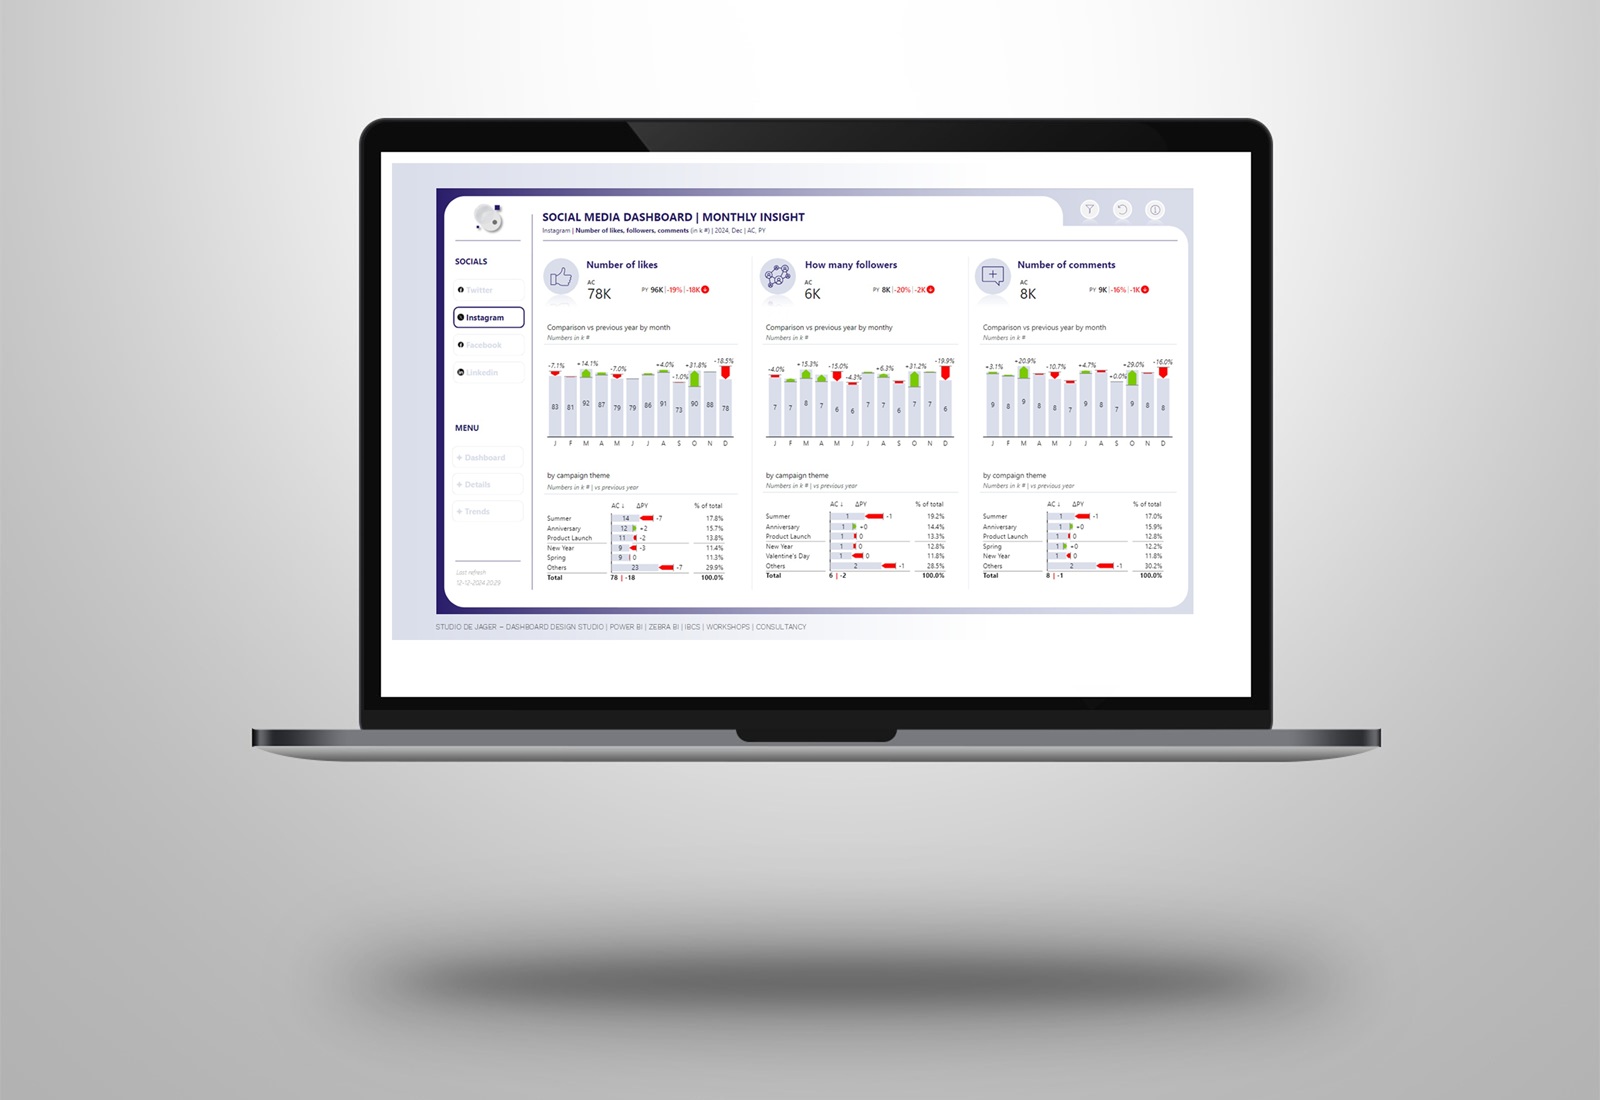
✅ In the second example I show another way to use them and only show the action dot, removed the data label.
𝐂𝐨𝐧𝐜𝐥𝐮𝐬𝐢𝐨𝐧
Sized dots are a 𝐜𝐨𝐦𝐩𝐚𝐜𝐭 𝐲𝐞𝐭 𝐩𝐨𝐰𝐞𝐫𝐟𝐮𝐥 𝐚𝐝𝐝𝐢𝐭𝐢𝐨𝐧 𝐭𝐨 𝐝𝐚𝐭𝐚 𝐯𝐢𝐬𝐮𝐚𝐥𝐢𝐳𝐚𝐭𝐢𝐨𝐧, offering a clear, responsive, and scalable way to represent relative variances. By saving space and simplifying comparisons, this visual type enhances the 𝐬𝐩𝐞𝐞𝐝 𝐚𝐧𝐝 𝐚𝐜𝐜𝐮𝐫𝐚𝐜𝐲 𝐨𝐟 𝐛𝐮𝐬𝐢𝐧𝐞𝐬𝐬 𝐢𝐧𝐬𝐢𝐠𝐡𝐭𝐬, making it a valuable feature for any data-driven professional.
What do you think about actions dots, Injae Park, Nicholas Lea-Trengrouse, Wilco Nagtzaam, Brian Julius?
🔔 Watch the video of Zebra BI BI specialist Mark Leskovšek, see link in the comments.
studiodejager.nl | dashboard design studio
Report & dashboard design | Official Zebra BI Partner | Power BI | IBCS – International Business Communication Standards Certified | Data visualization | Interim business consultancy