Power BI | Isloep dashboard
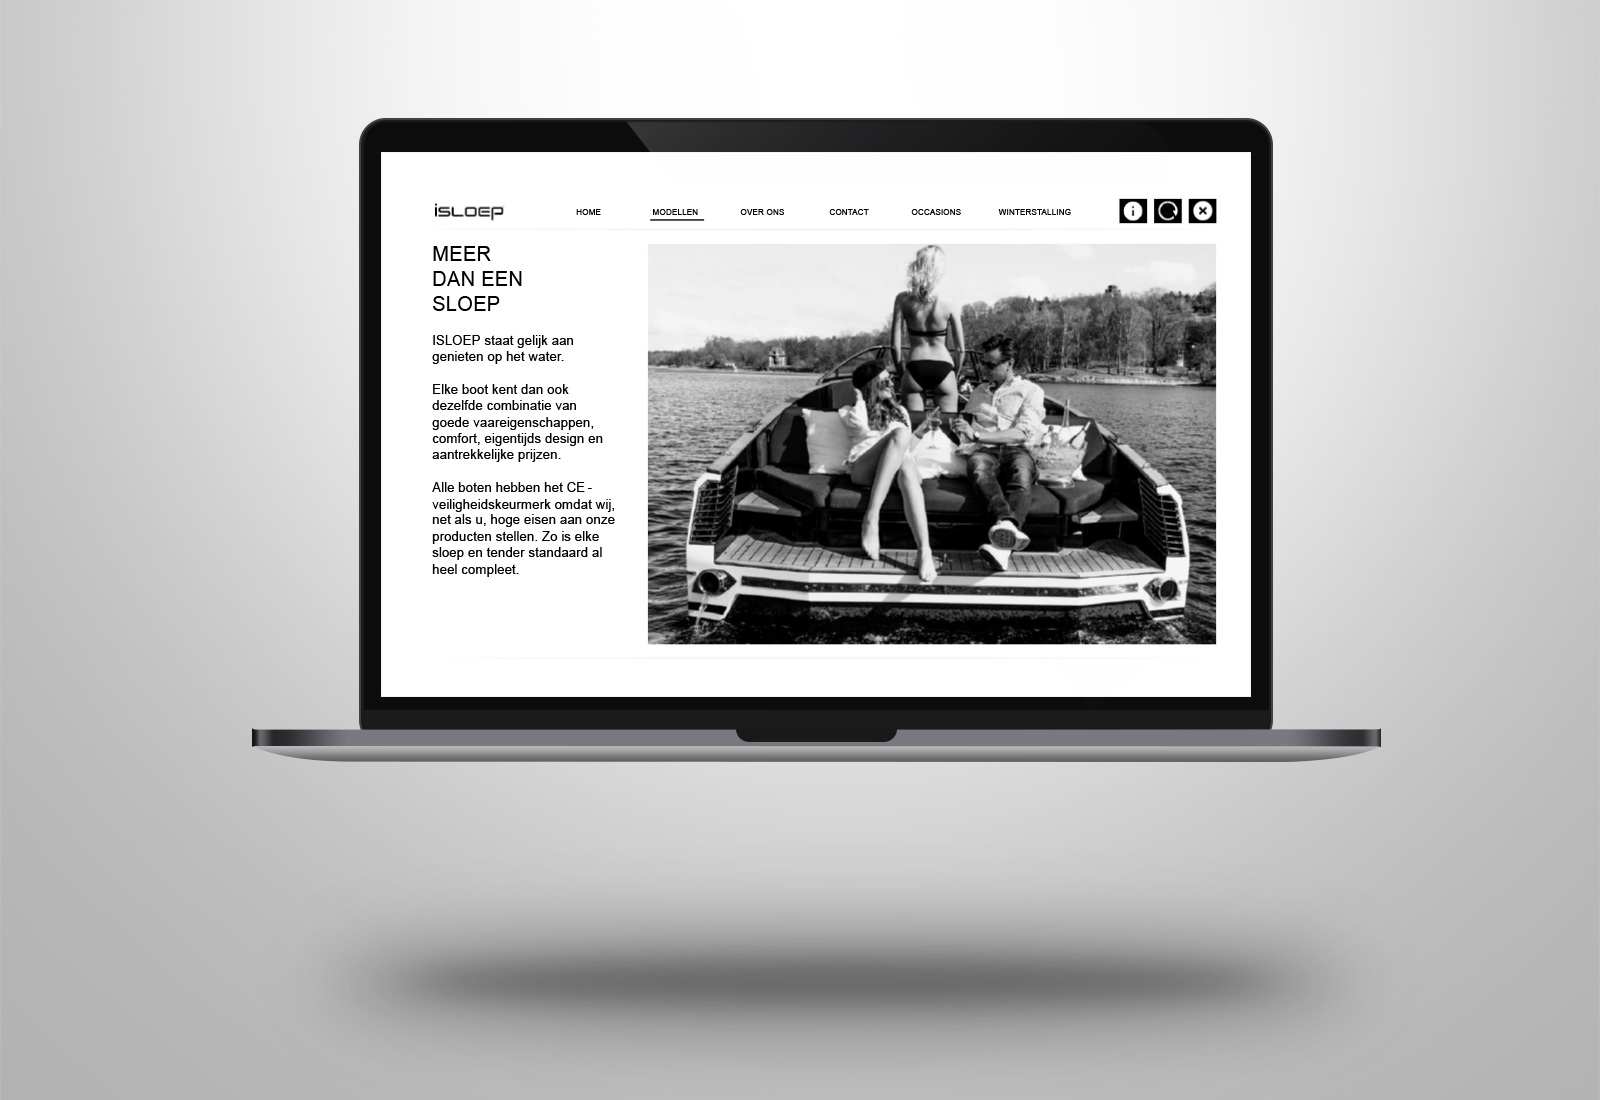
During the summer period I’d like to spent a lot of time on my boat with my family and friends. We always have fun and sailing with the boot gives a lot of relaxation. My personal favorite, the isloep 735 !
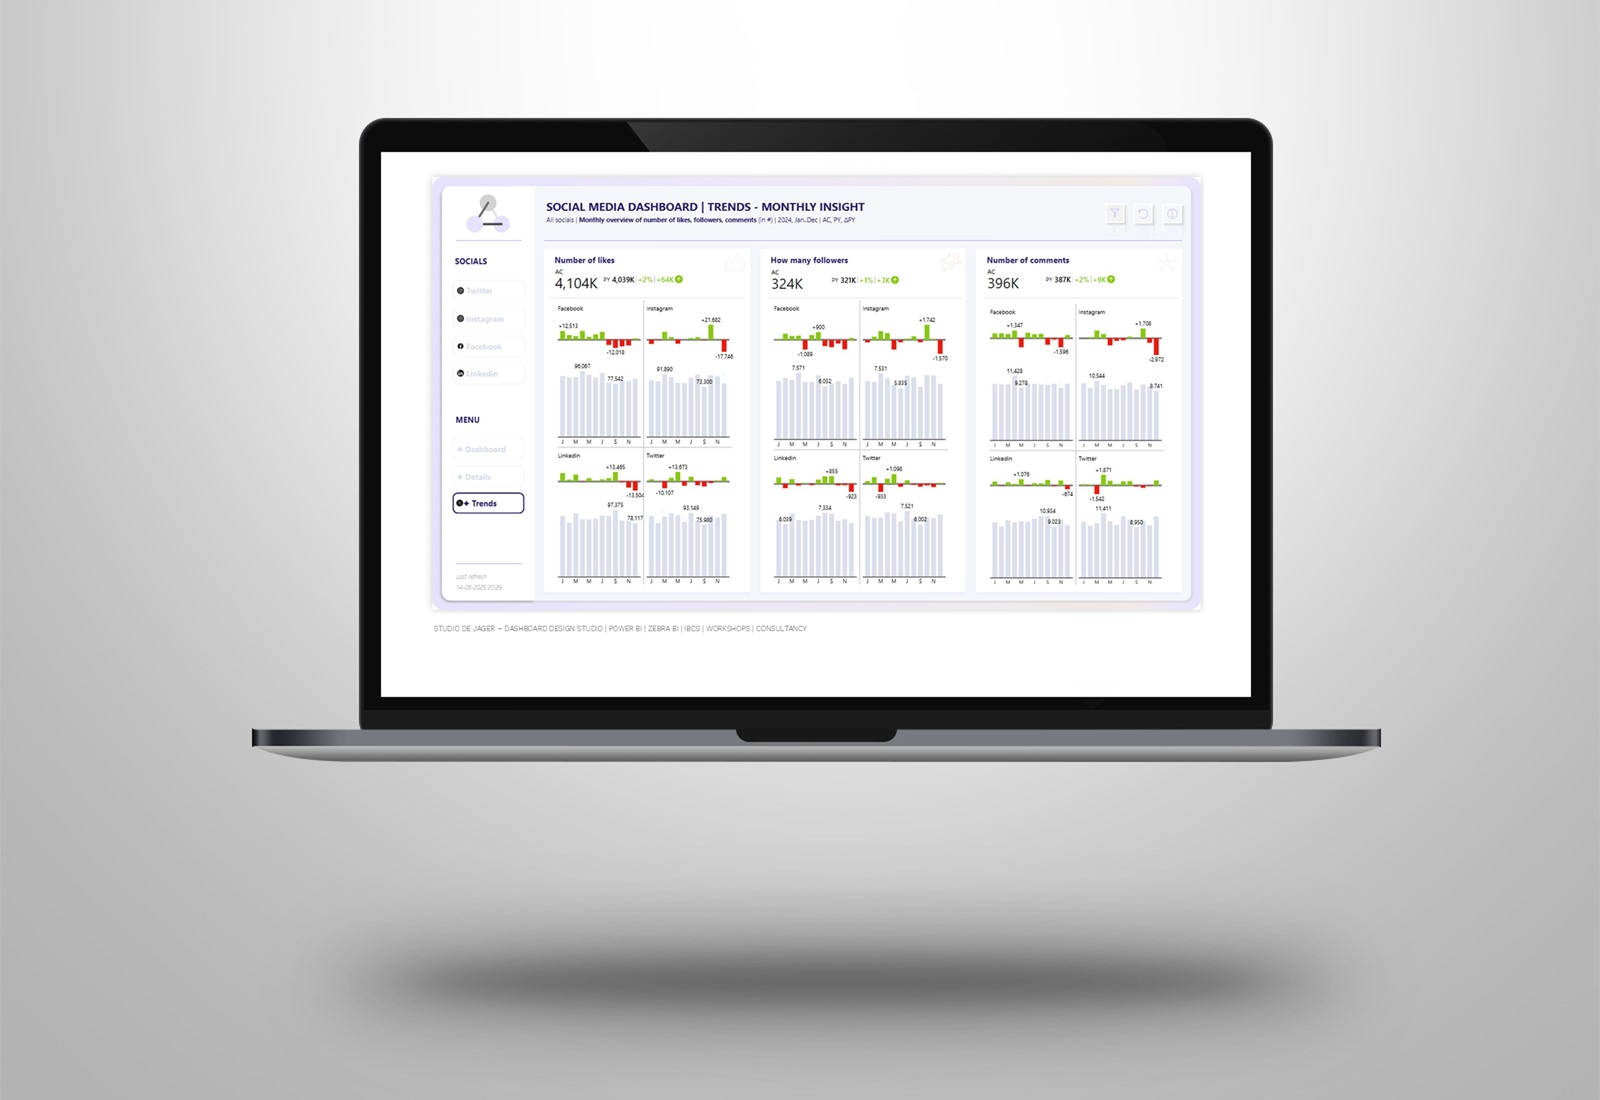
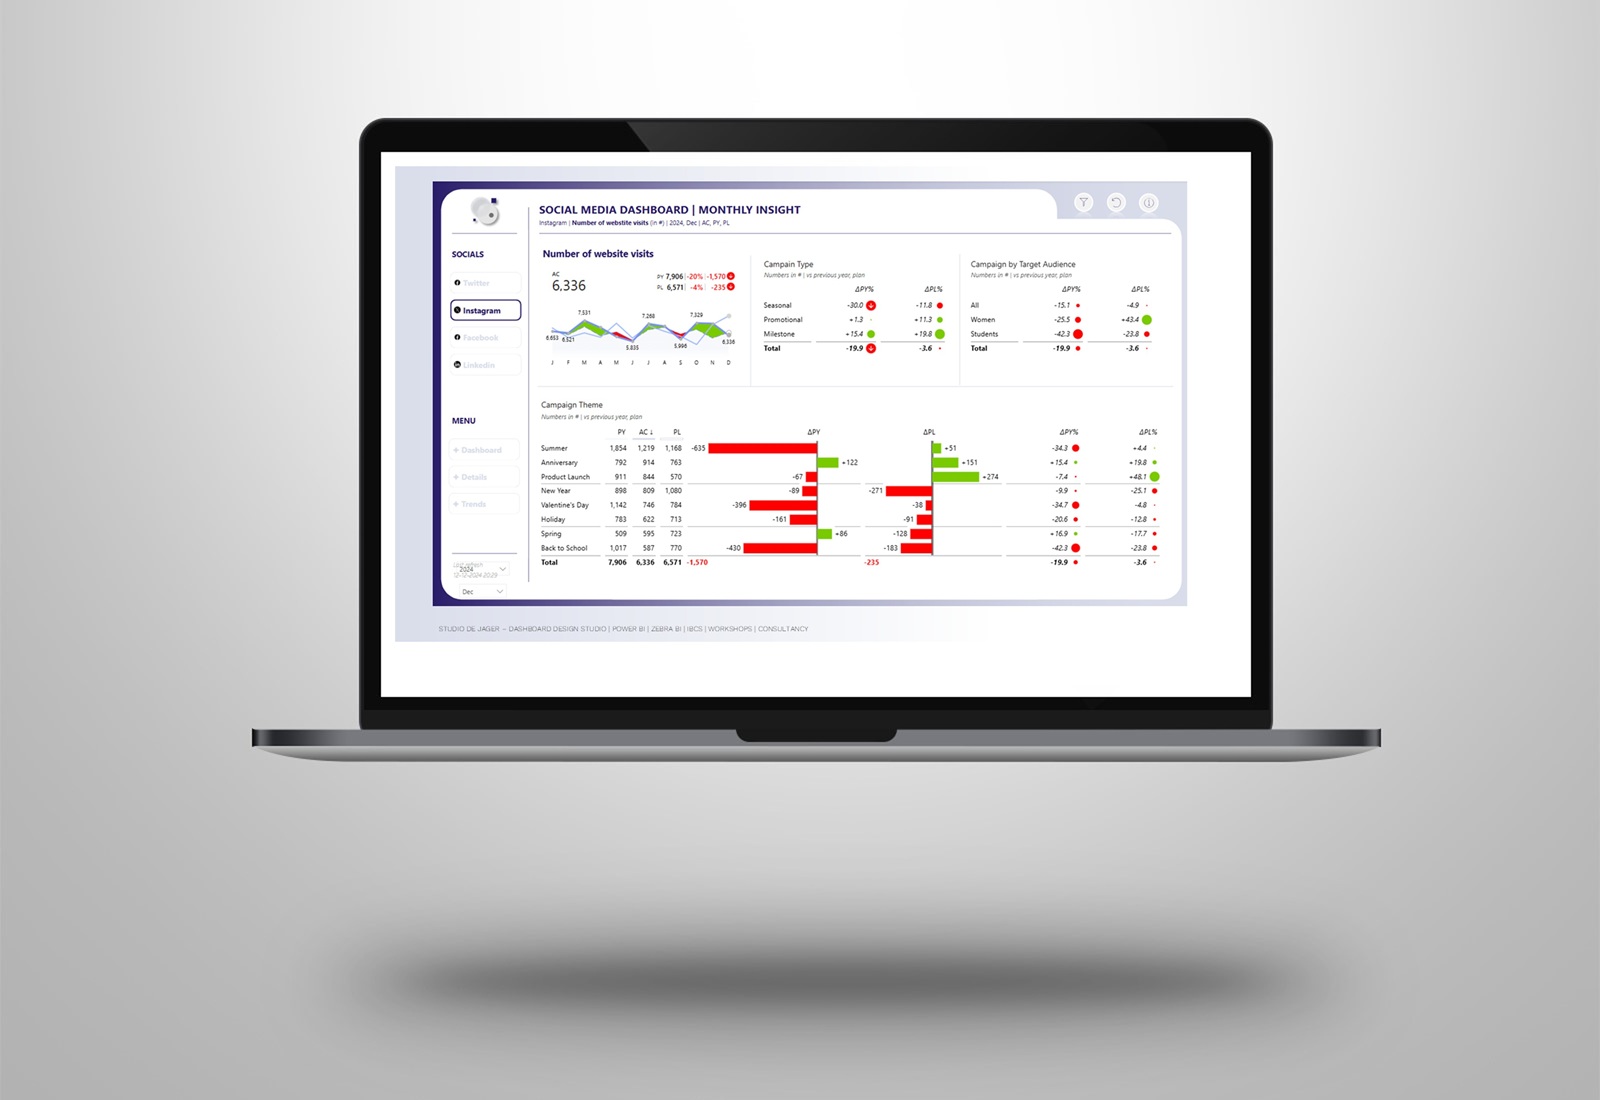
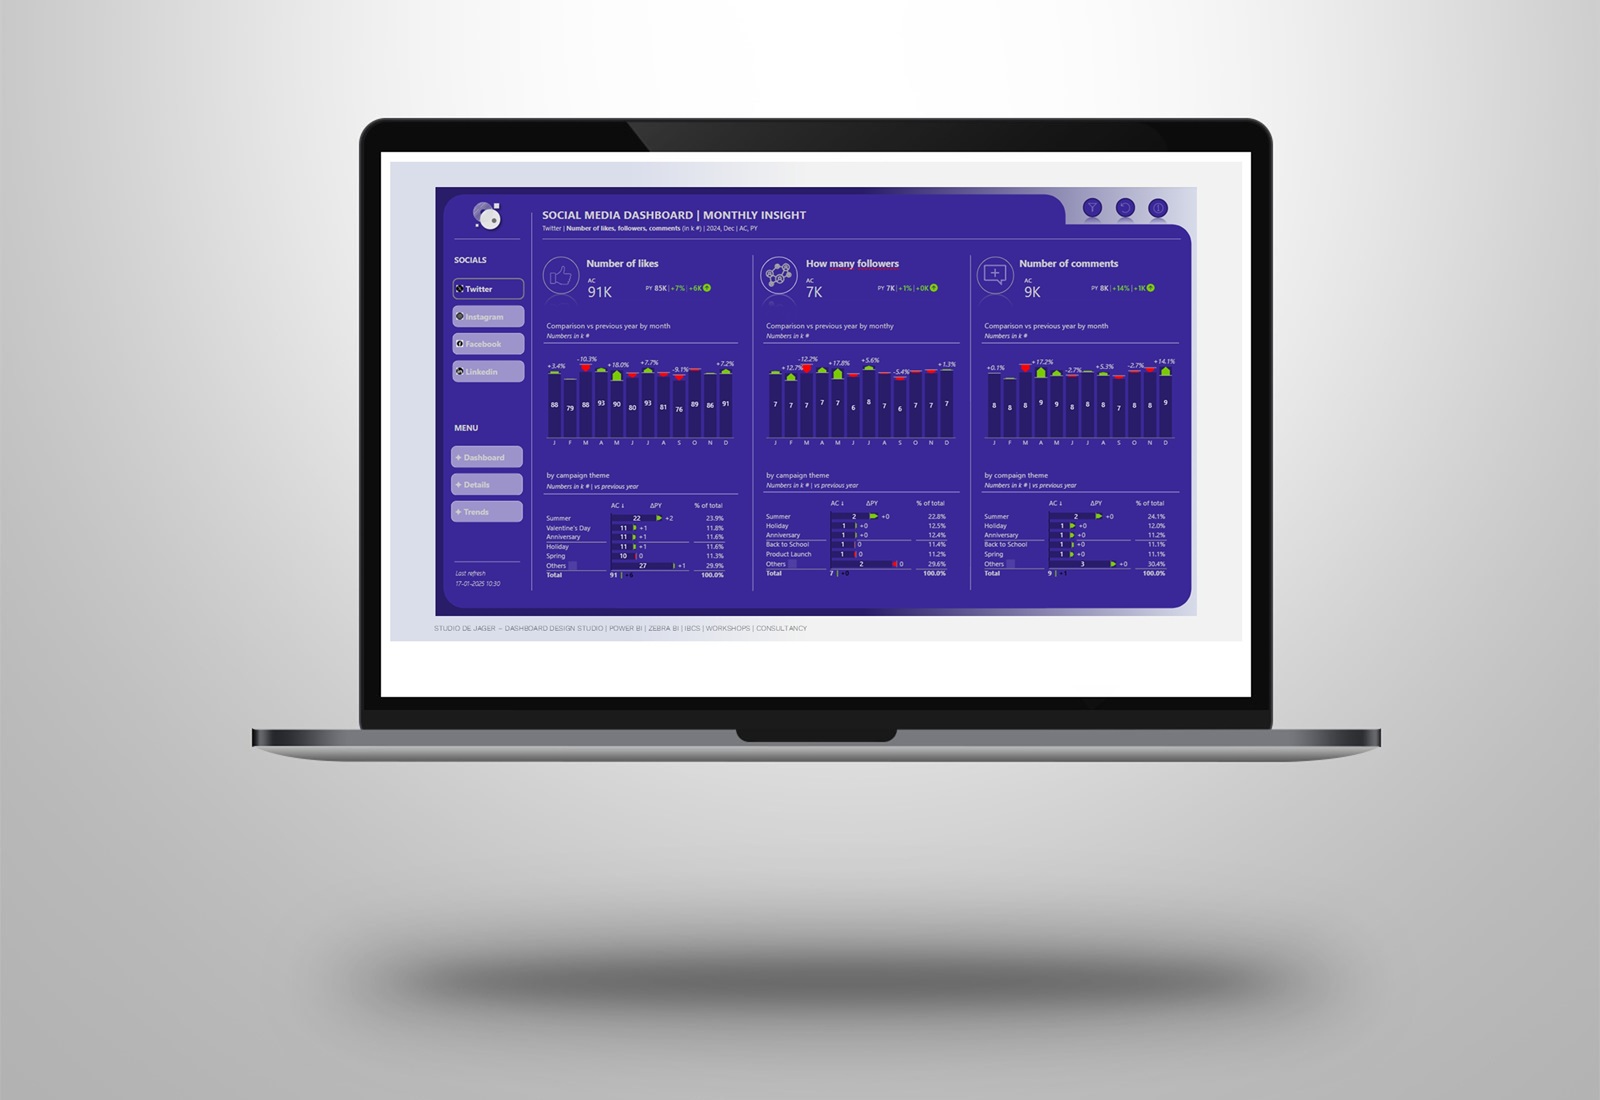
Recently Zebra BI released the last update before the summer period (v5.0) with a lot of great new features. My favorite, the stacked bar charts. I created a new dashboard with demo data and combined the Zebra BI update with the Isloep design. Designed all the individual elements such as backgrounds, colors, buttons, text and animation effects in PowerPoint and brought this together with a lot of bookmarks and buttons in Microsoft Power BI.
Hope to inspire other people to use their creativity a lot more in Power BI.
Isloep is a Dutch boat building company. Every boat they make has the same combination of good handling characteristics, comfort and modern design.
More info: isloep.nl
Thanks Isloep for giving us all the pleasure.
