Power BI | Maven Analytics - Sales Challenge
I had some time this weekend to participate in the Maven Analytics sales challenge.
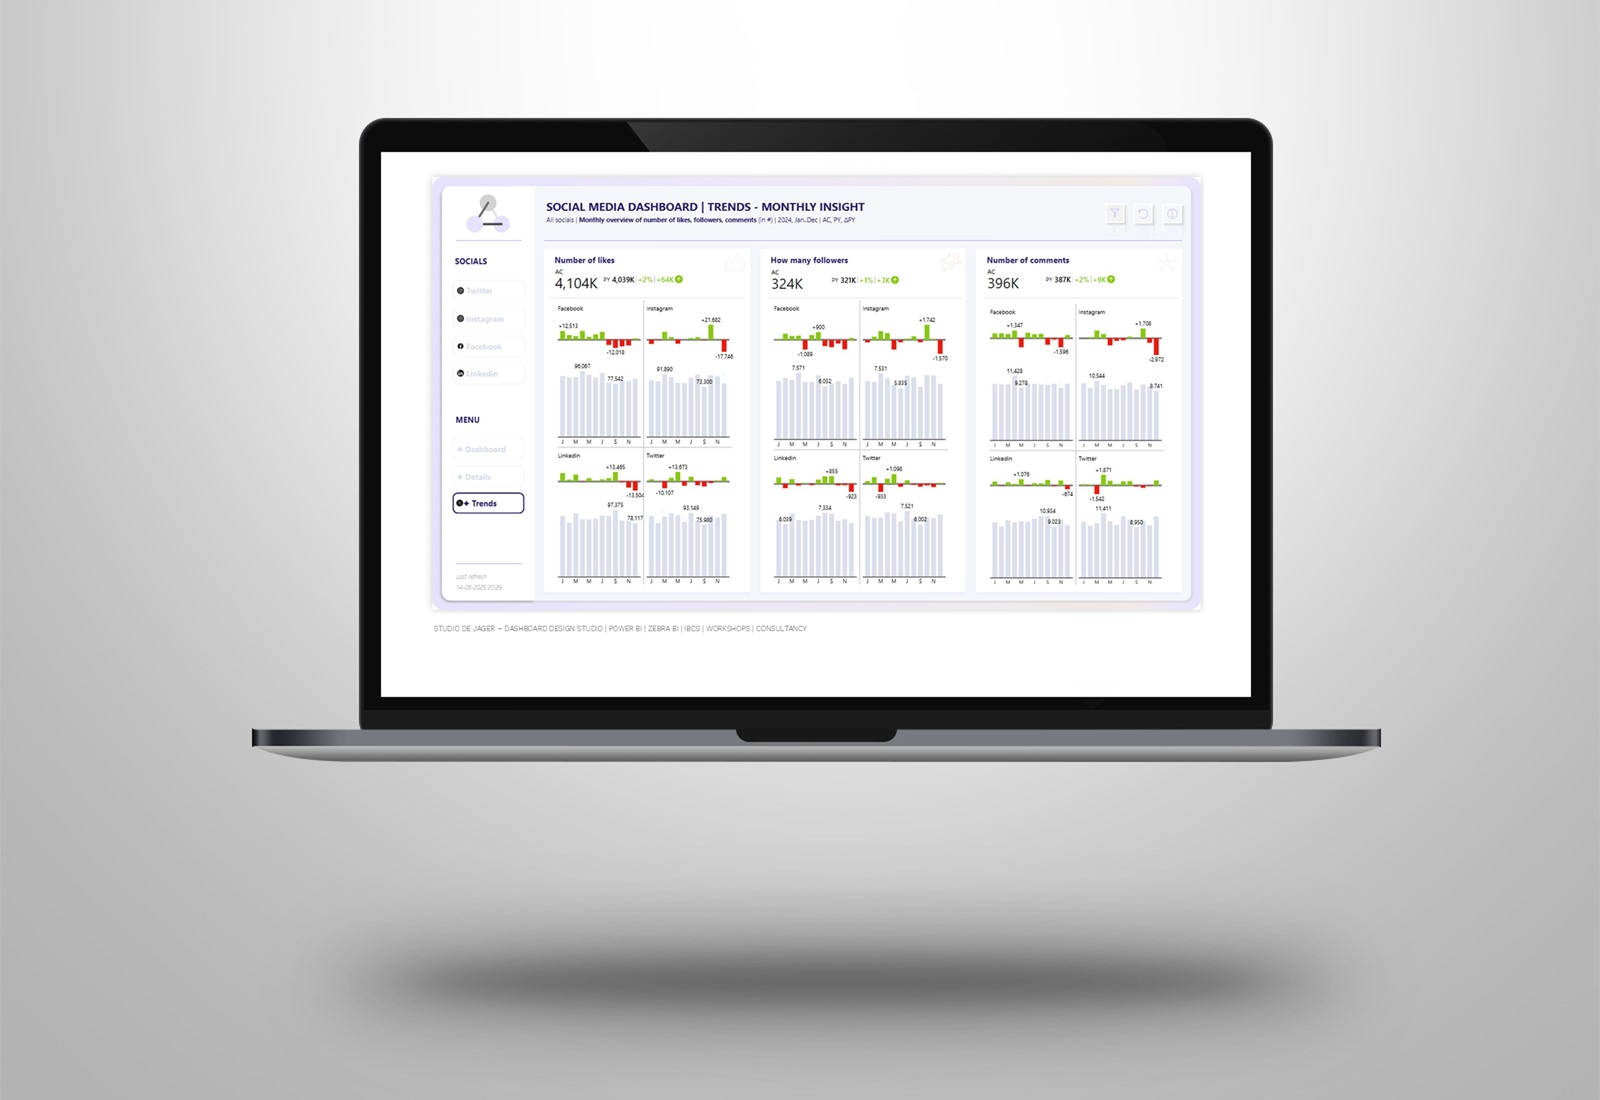
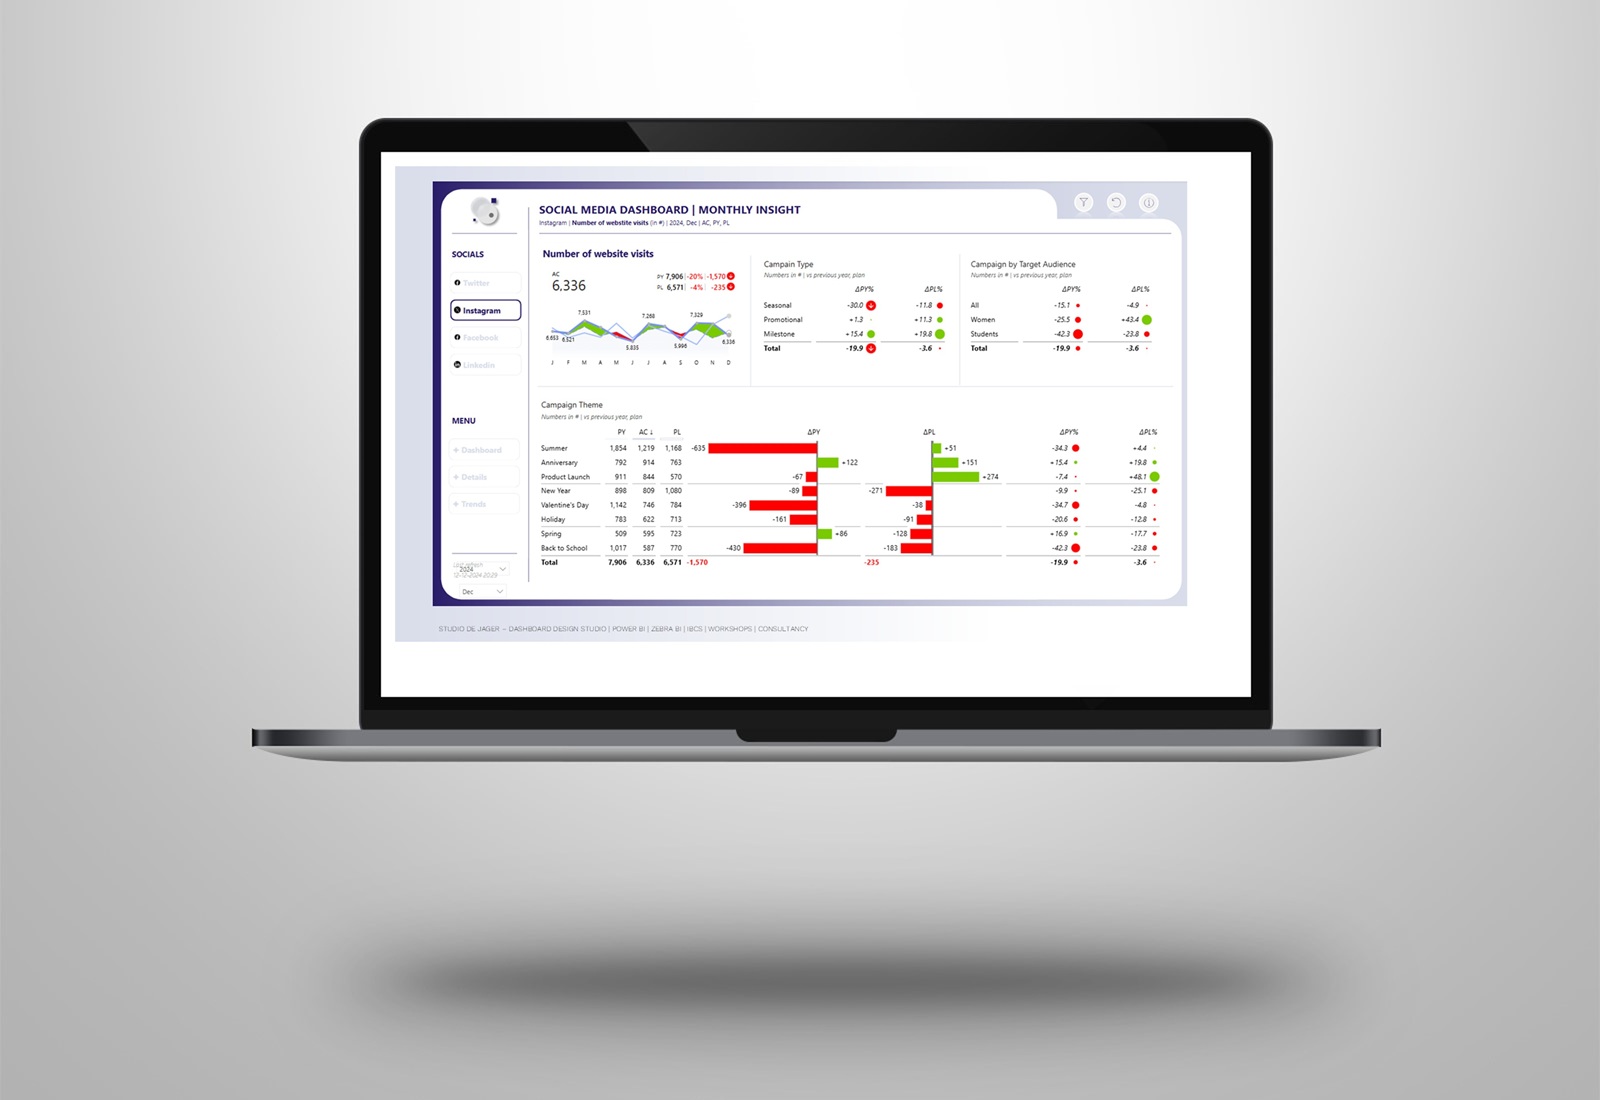
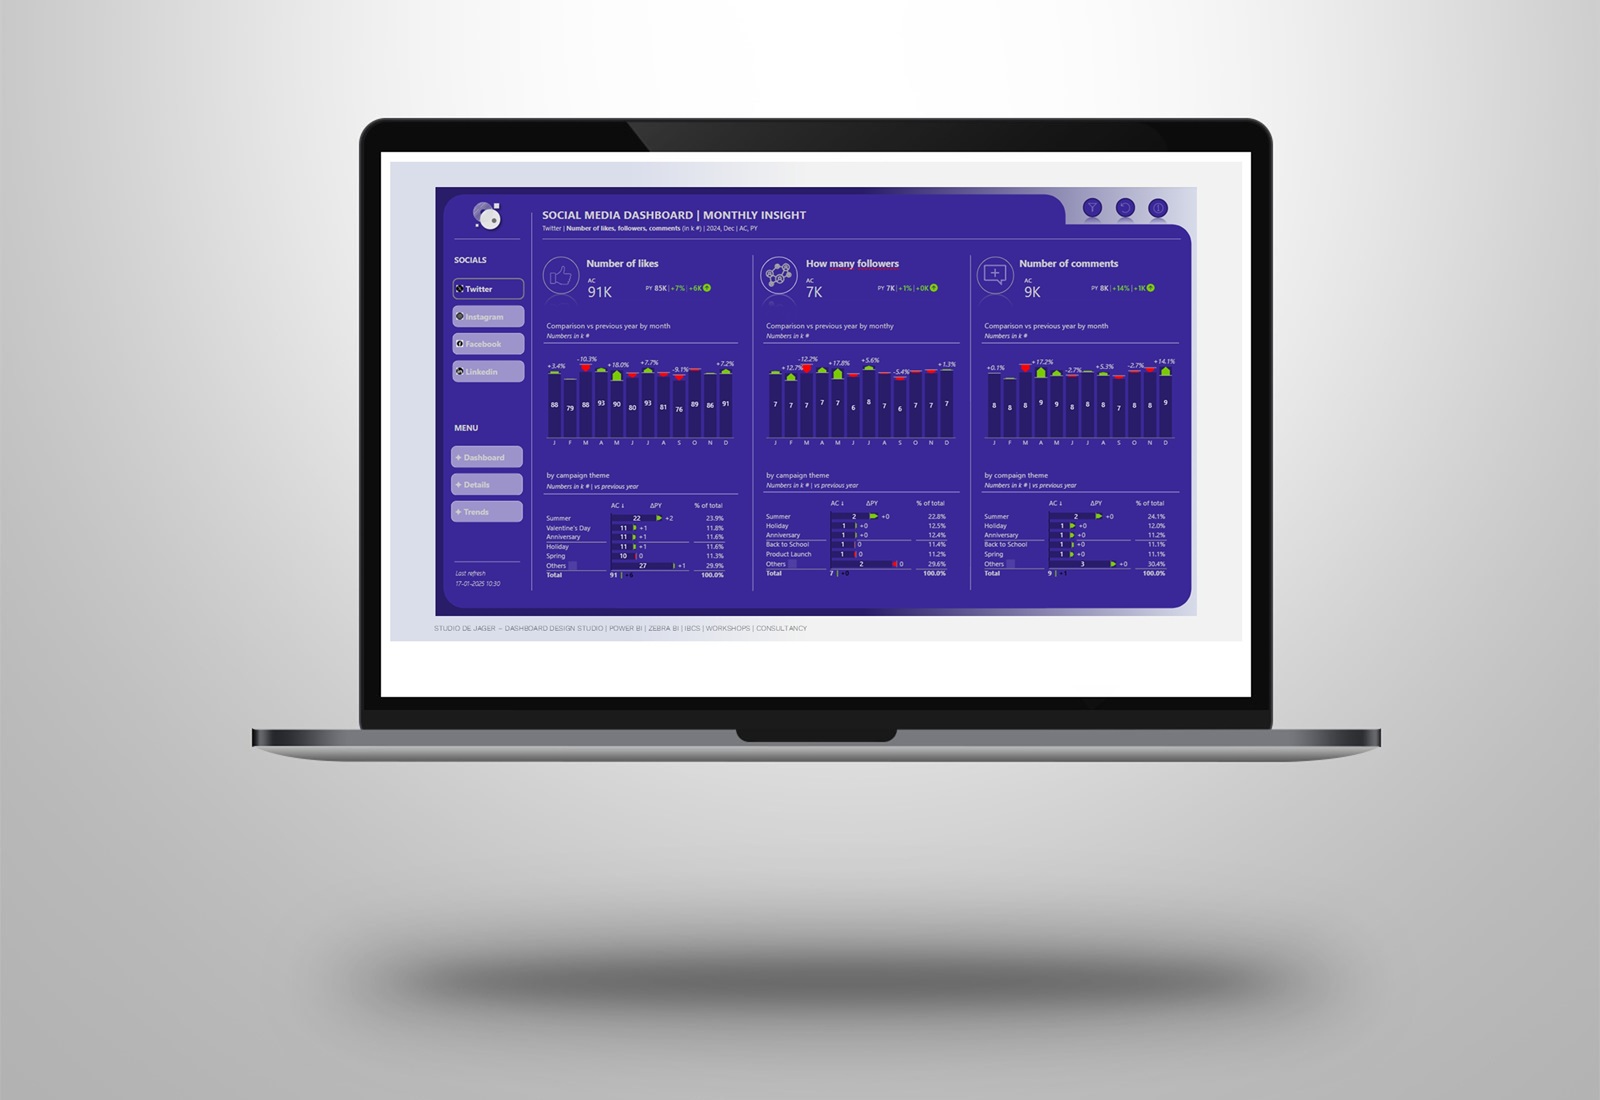
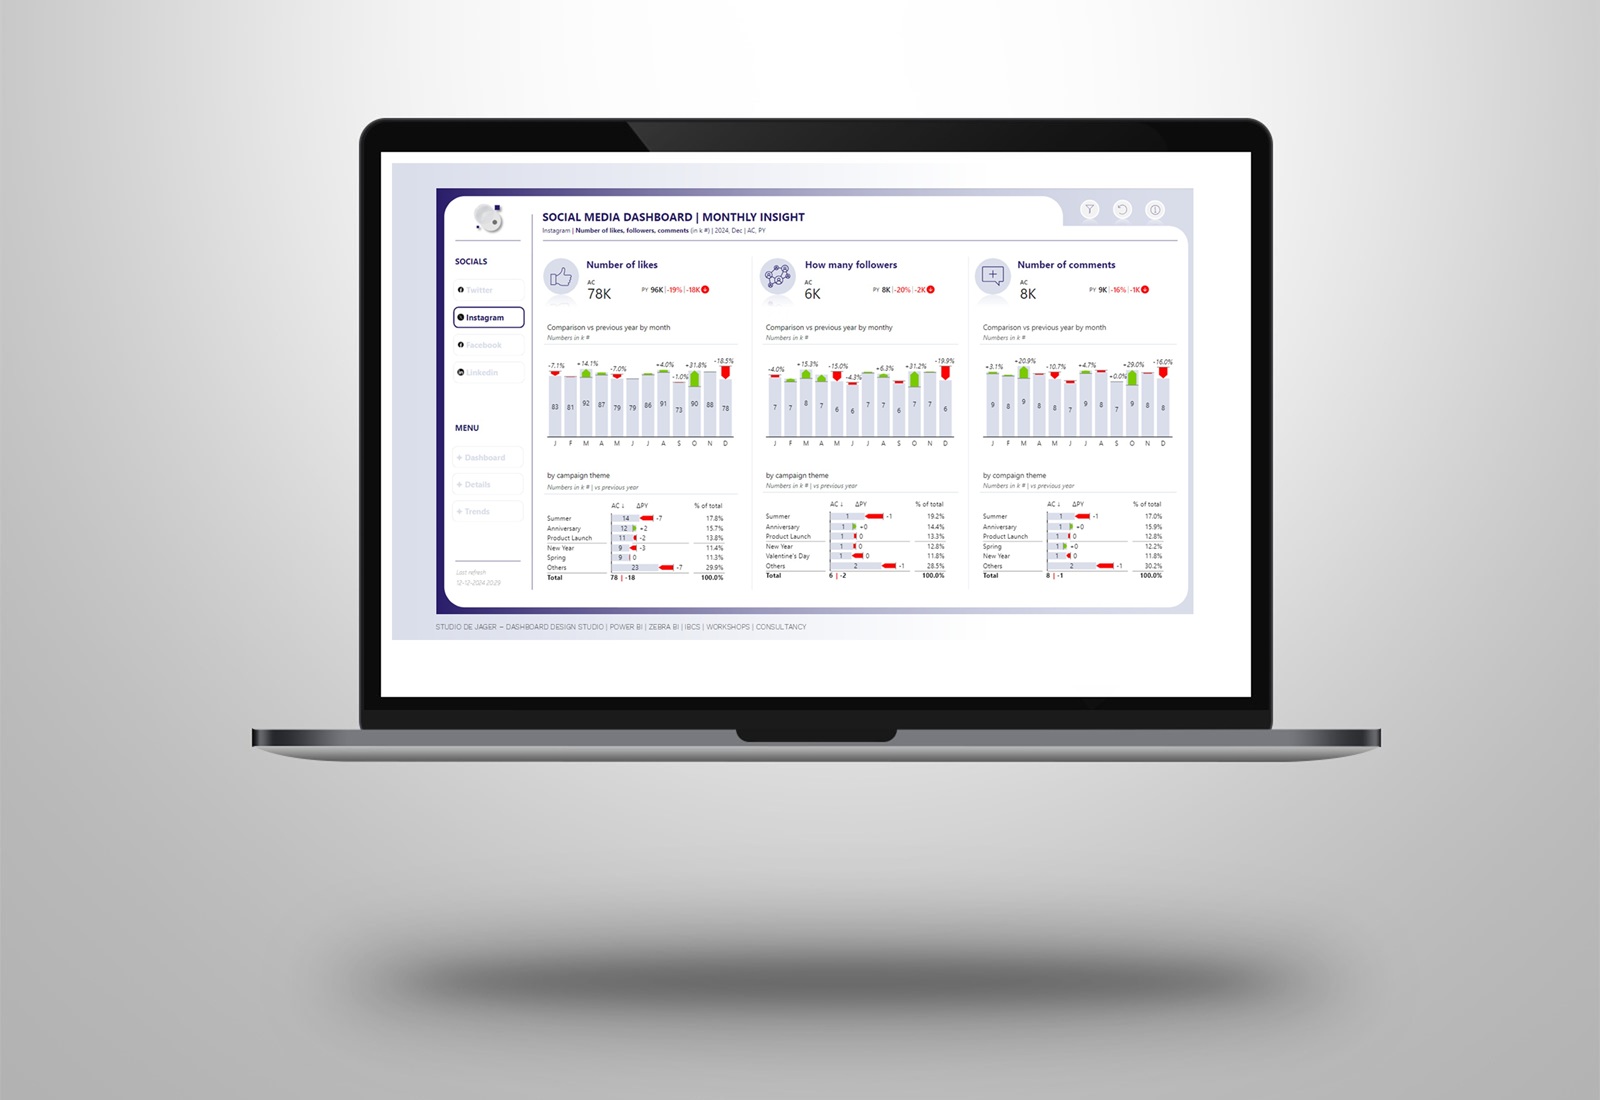
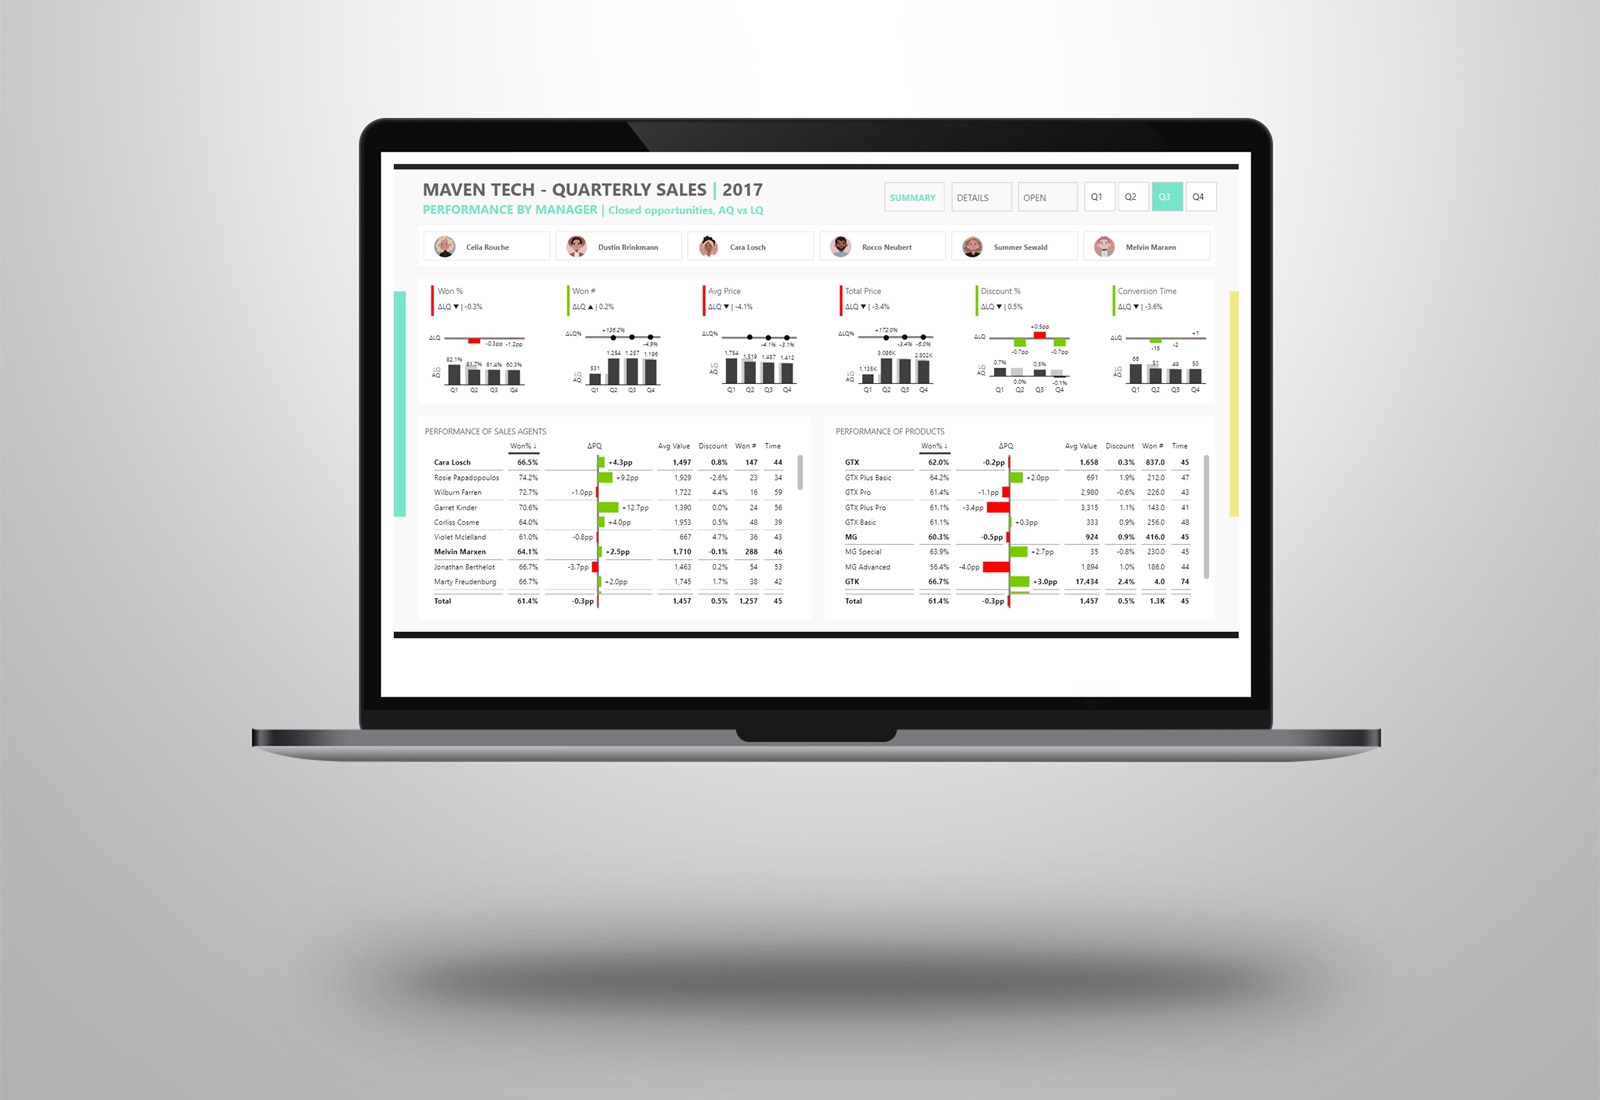
The goal was to create an interactive Power BI dashboard that enables sales managers to track their team’s quarterly performance.
Used parts in the dashboard:
1. Zebra BI chart and table visuals
2. New Card visuals
3. New Slicer
4. For the design, I decided to keep it very clean and applied the colors of Maven Analytics very subtly in the dashboard.
I decided to give the managers a face. To be able to use the pictures from OneDrive I used a method from Bas Dohmen that he recently posted.
Youtube video: THE BEST way to add IMAGES from OneDrive & SharePoint in Power BI
Integrated New Card visuals with Zebra BI chart, used the accent bars to give a quarterly performance indicator for each KPI.
It was fun to participate and incorporate the above parts into the dashboard, especially playing around with the new card visual and new slicer created by the PBI Core Visuals team of Miguel Myers.
Hope you like it !
Sasjah de Jager
Report & dashboard design | Official Zebra BI Partner | Power BI – Excel | IBCS Certified Analyst | Data visualization | Interim business consultancy
Let’s create better reports & dashboards !