Power BI | Schmitten SKI dashboard
𝐒𝐂𝐇𝐌𝐈𝐓𝐓𝐄𝐍 𝐃𝐀𝐒𝐇𝐁𝐎𝐀𝐑𝐃 – 𝐔𝐋𝐓𝐈𝐌𝐀𝐓𝐄 𝐒𝐊𝐈 𝐄𝐗𝐏𝐄𝐑𝐈𝐄𝐍𝐂𝐄 𝐃𝐄𝐒𝐈𝐆𝐍
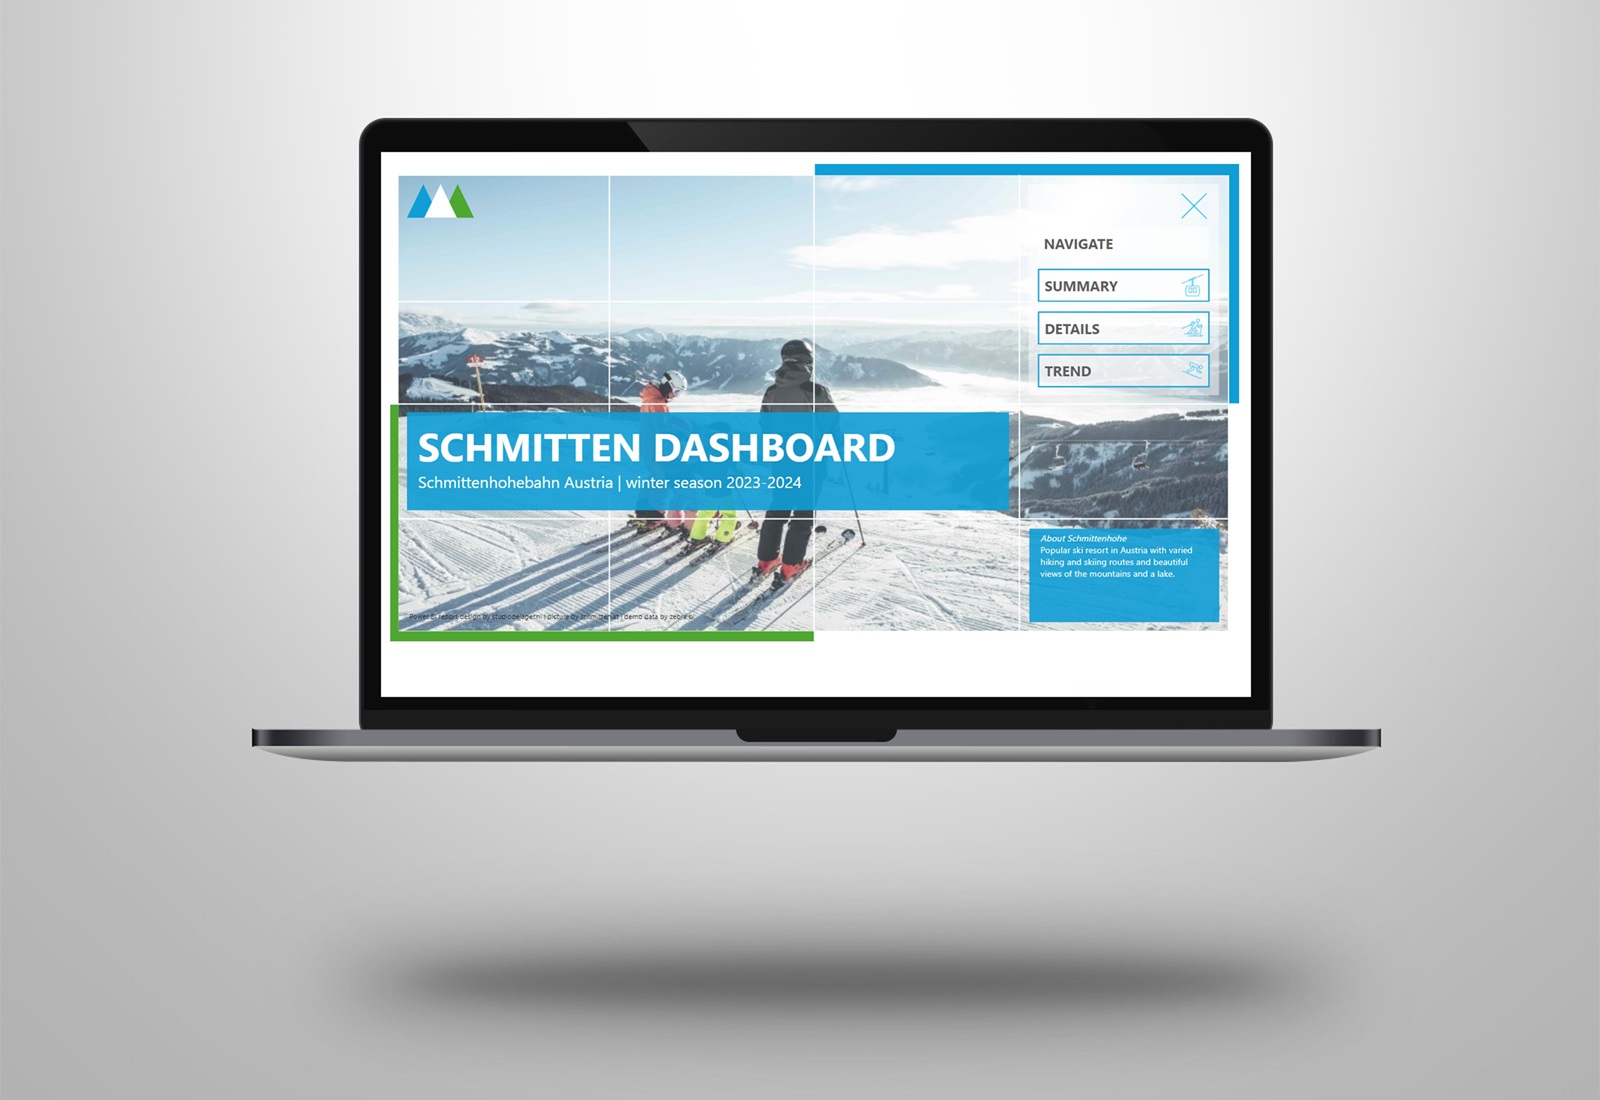
I am thrilled to share with you an exciting new project I’ve been working on – the Schmitten Power BI dashboard!
Inspired by the recent visit with my family to the Schmitten ski area in Austria, I’ve created this website-inspired dashboard that captures the essence of the Schmitten ski experience.
Merging data elegance with corporate design, I’ve incorporated Zebra BI charts & tables to deliver actionable insights in this dashboard.
𝐊𝐞𝐲 𝐅𝐞𝐚𝐭𝐮𝐫𝐞𝐬
✅ Dynamic landing page
✅ Animated logo on report pages
✅ Corporate design integration
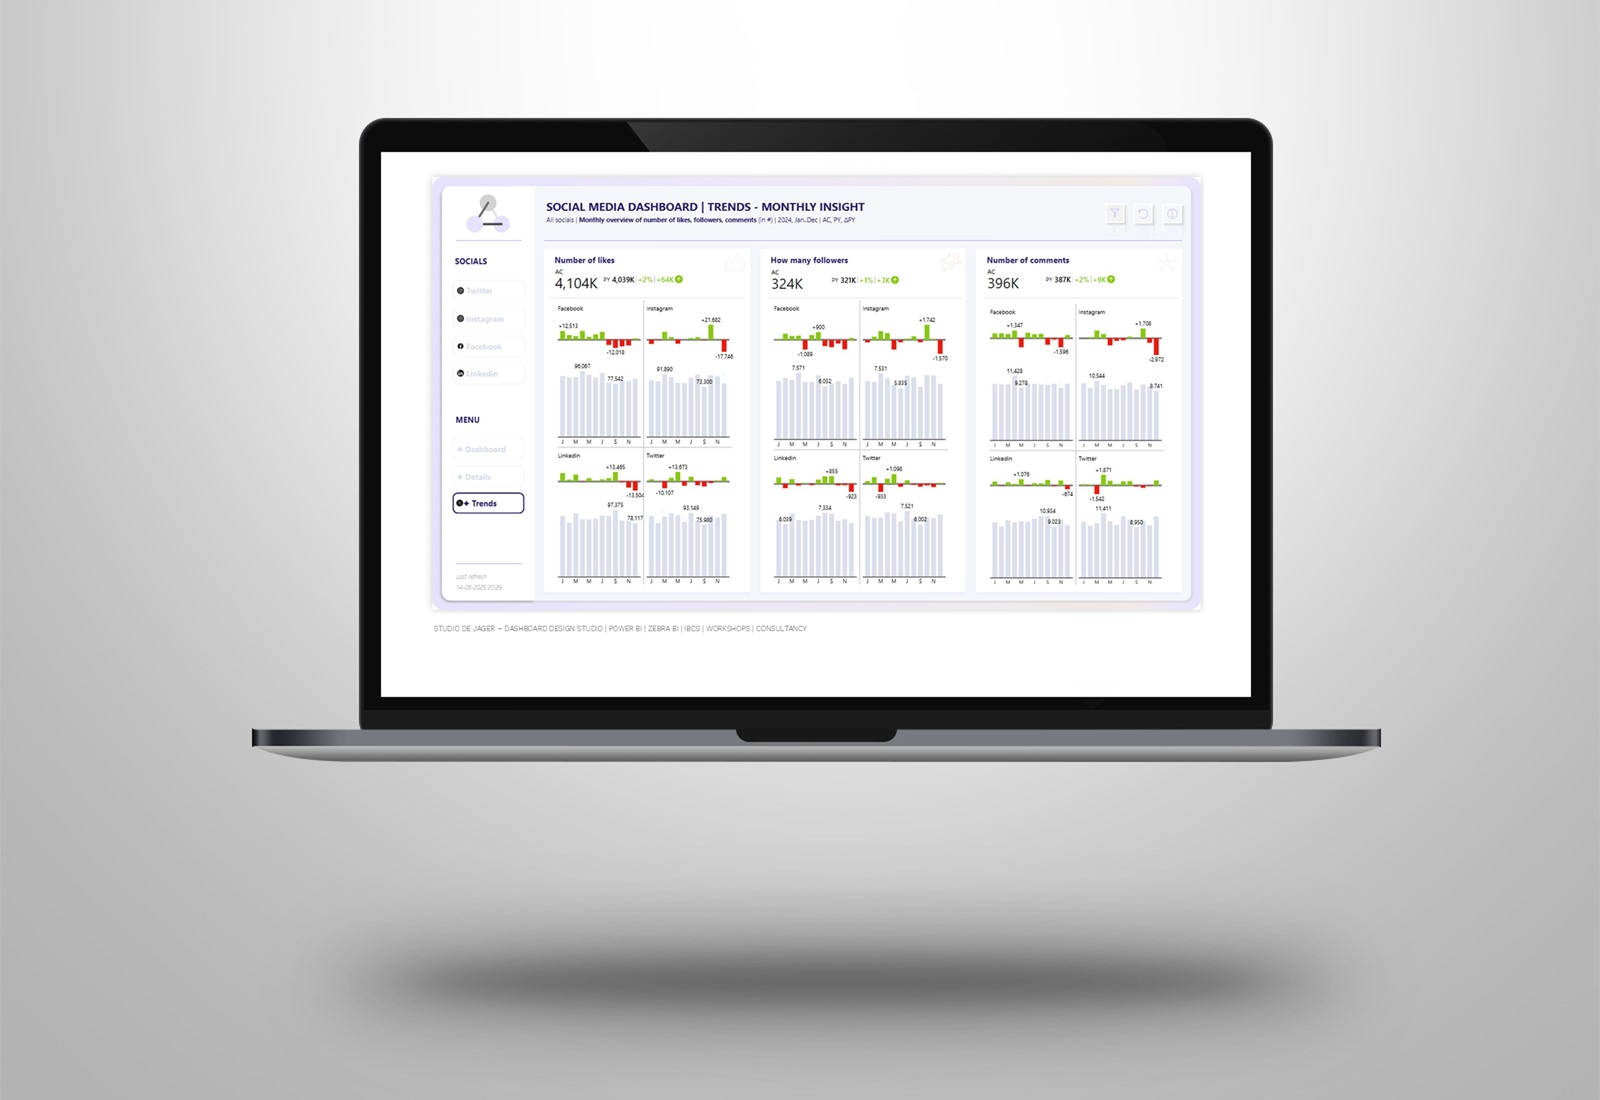
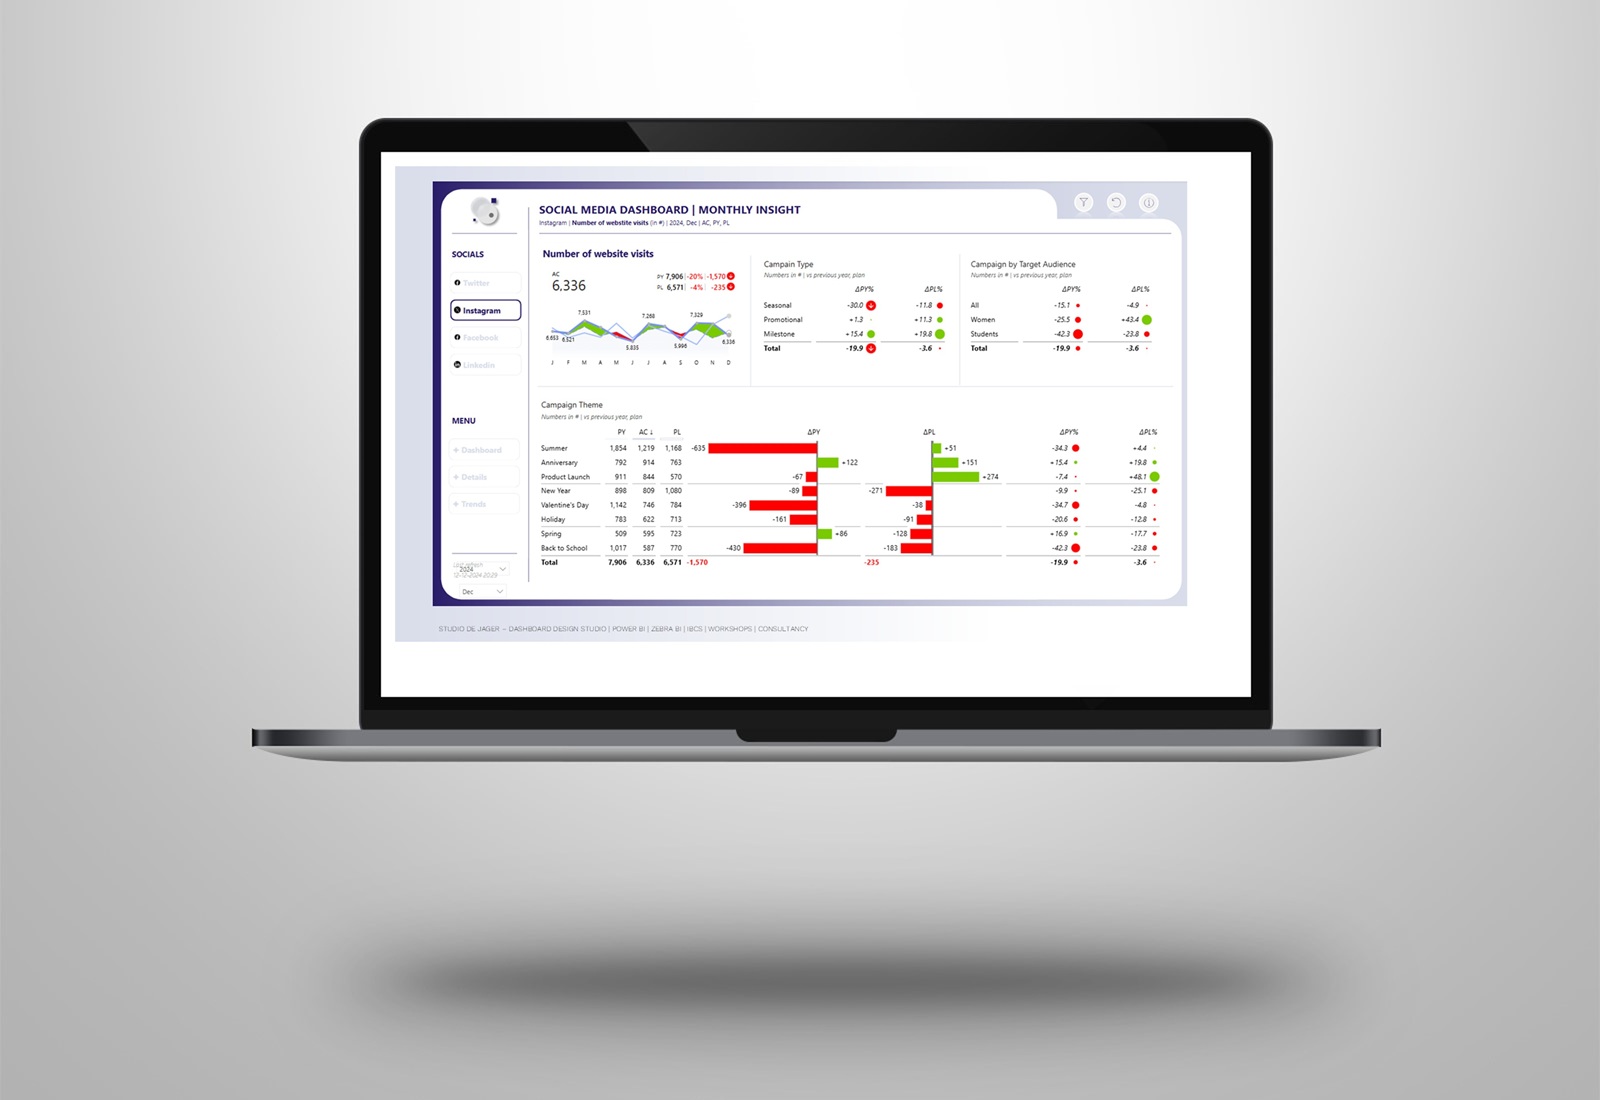
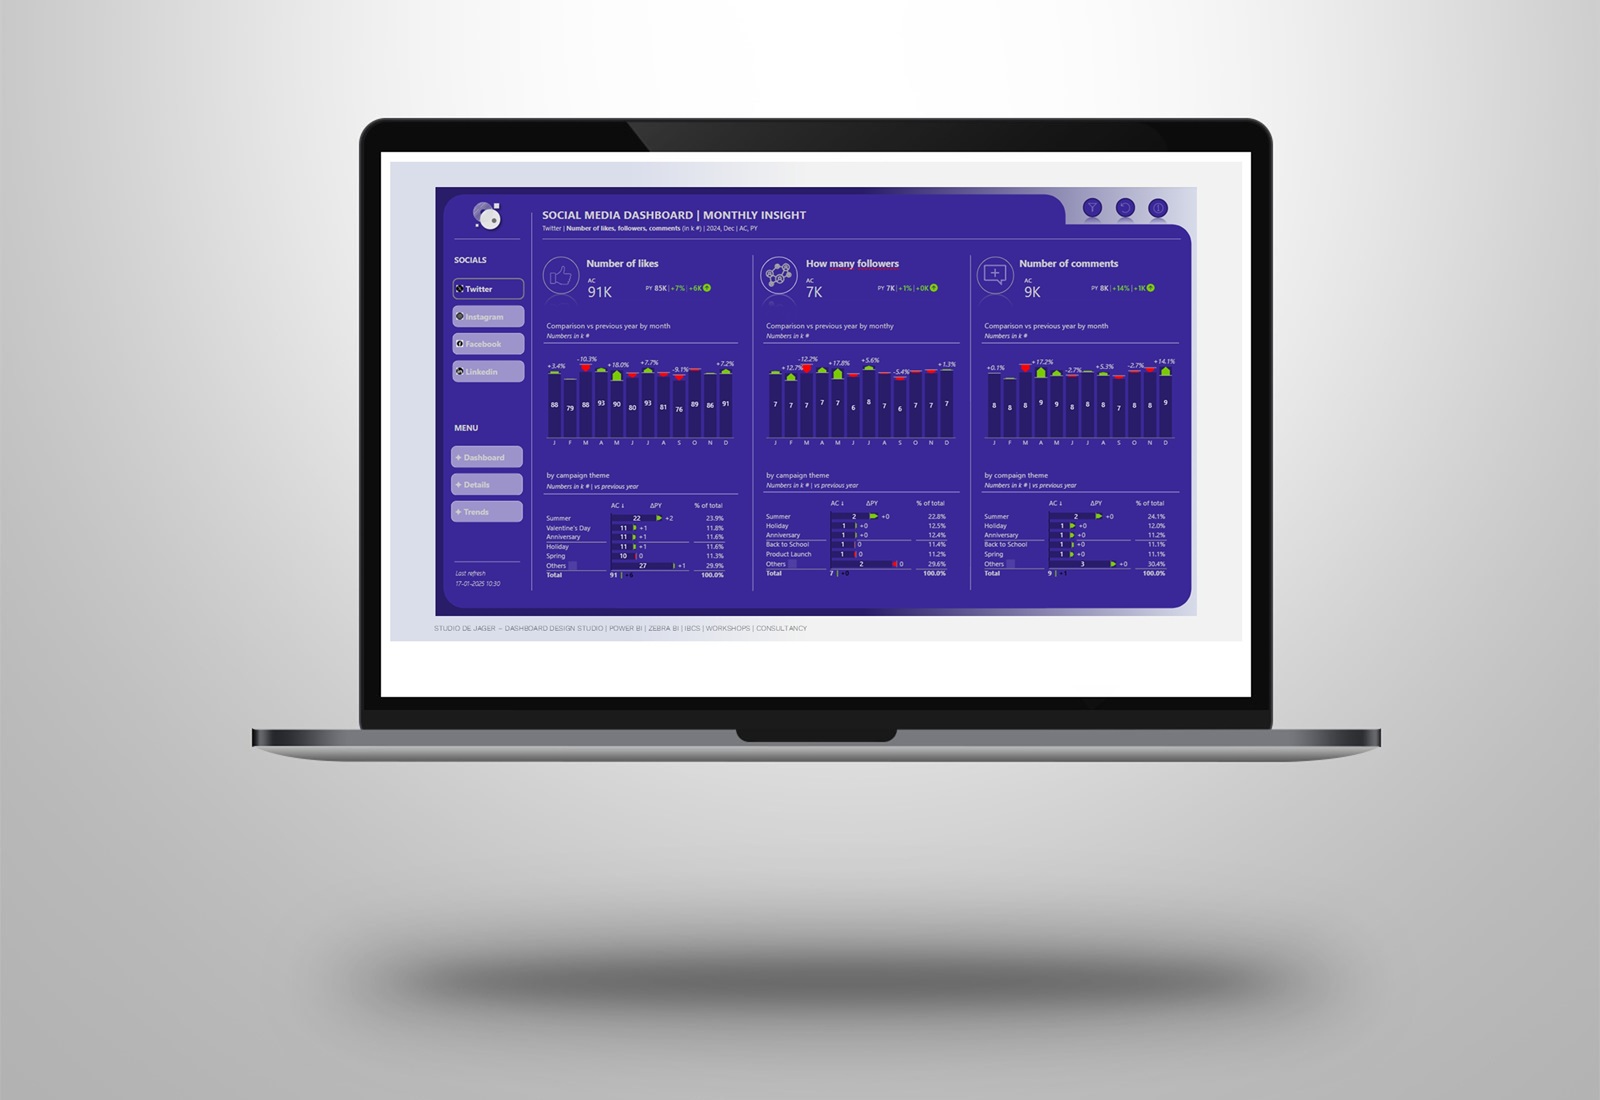
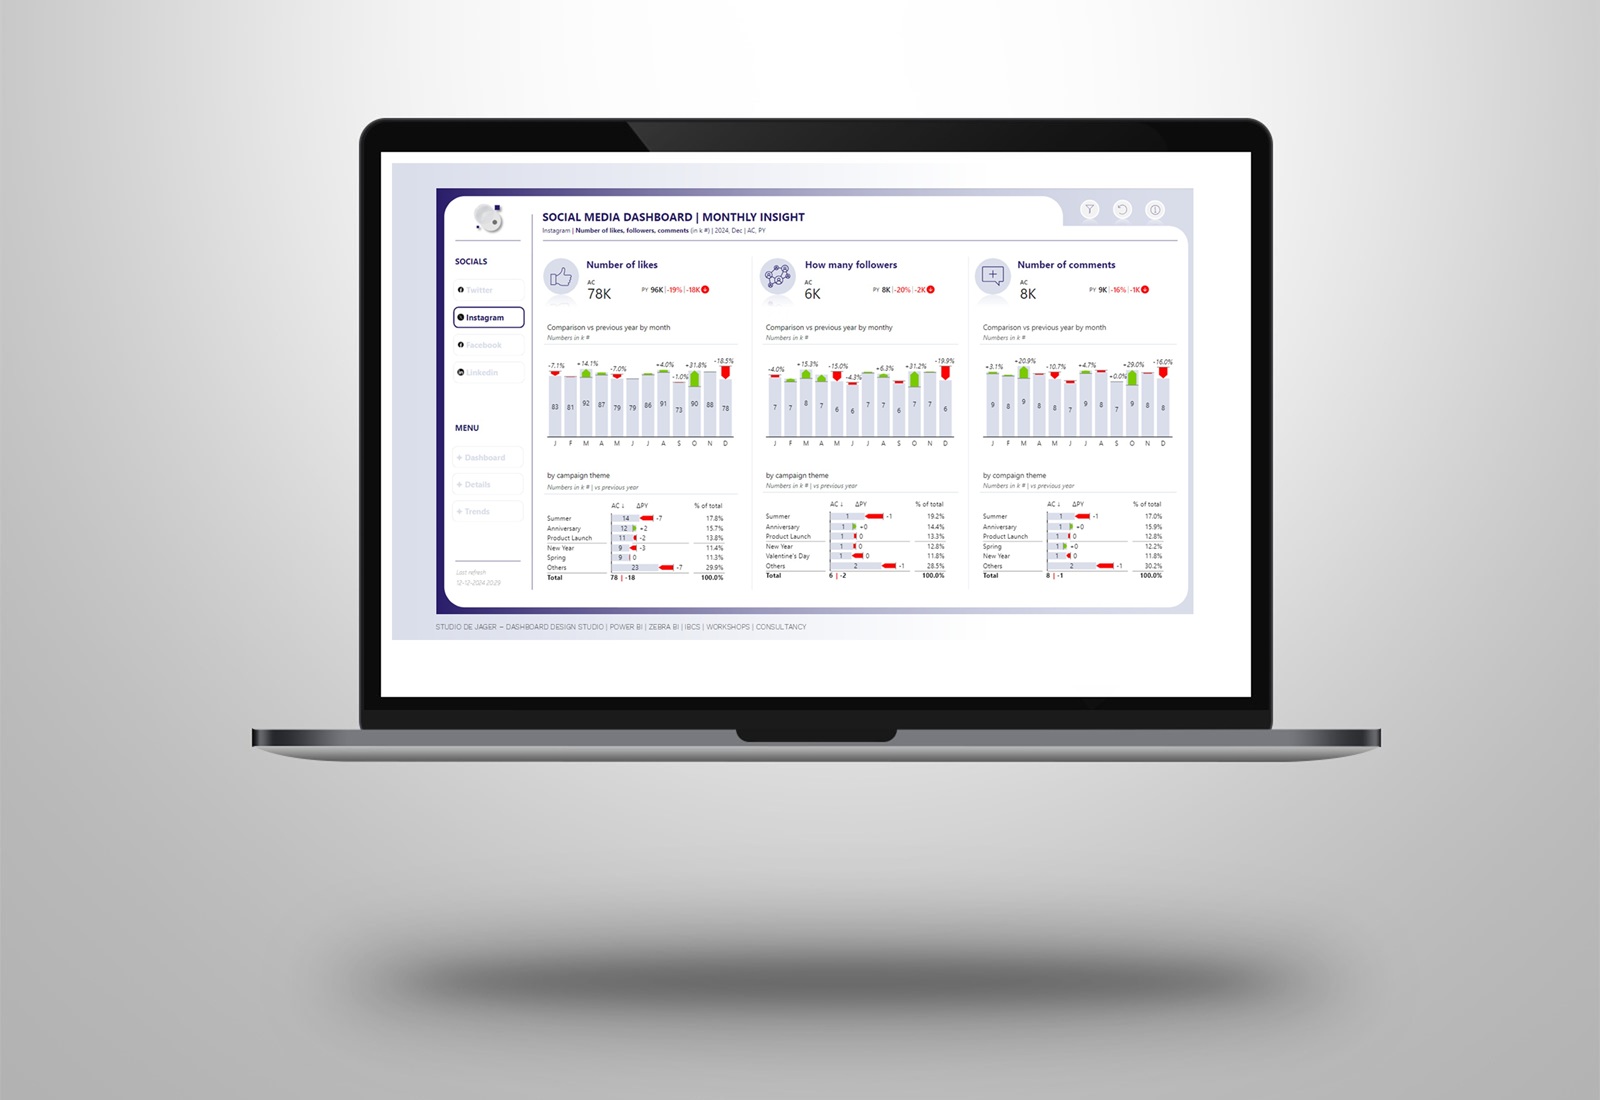
✅ Applying IBCS – International Business Communication Standards with Zebra BI visuals
◾ 𝐃𝐲𝐧𝐚𝐦𝐢𝐜 𝐥𝐚𝐧𝐝𝐢𝐧𝐠 𝐩𝐚𝐠𝐞: To add a touch of dynamism, the landing page features an animated SVG picture, capturing the vibrancy and energy of the Schmitten ski area. I’ve used some code by Animista to transform a simple JPG picture into an animated background.
◾ 𝐀𝐧𝐢𝐦𝐚𝐭𝐞𝐝 𝐥𝐨𝐠𝐨 𝐨𝐧 𝐫𝐞𝐩𝐨𝐫𝐭 𝐩𝐚𝐠𝐞𝐬: In all the pages you find an animated SVG logo. I’ve made this logo in PowerPoint, transformed it into a SVG file and made it a dynamic using Animista.
Jefferson Alves has some interesting video’s in how to create SVG animtation with the use the Animista tool.
◾ 𝐂𝐨𝐫𝐩𝐨𝐫𝐚𝐭𝐞 𝐝𝐞𝐬𝐢𝐠𝐧 𝐢𝐧𝐭𝐞𝐠𝐫𝐚𝐭𝐢𝐨𝐧: The dashboard seamlessly incorporates the corporate design of the Schmitten website, ensuring a cohesive and visually pleasing experience.
◾ 𝐙𝐞𝐛𝐫𝐚 𝐁𝐈 𝐯𝐢𝐬𝐮𝐚𝐥𝐬: Elevating data visualization and applying IBCS, I’ve used Zebra BI charts and tables to provide a clear and insightful representation of the number of visitors to the ski area.
📌 Explore the Schmitten dashboard by following the link in the comments and experience the power of data visualization in the context of the Schmitten ski area.
🔔 Free Power BI template: Get your free template, in the comments I provide the link to the free Power BI template from Zebra BI which I used in this project.
Hope you inspire the community with showing some of the possibilities in Power BI !
I look forward hearing your thoughts and feedback!
Sasjah de Jager
Report & dashboard design | Official Zebra BI Partner | Power BI – Excel | IBCS Certified Analyst | Data visualization | Interim business consultancy
Let’s create better reports & dashboards !