Power BI | The power of scenario colors
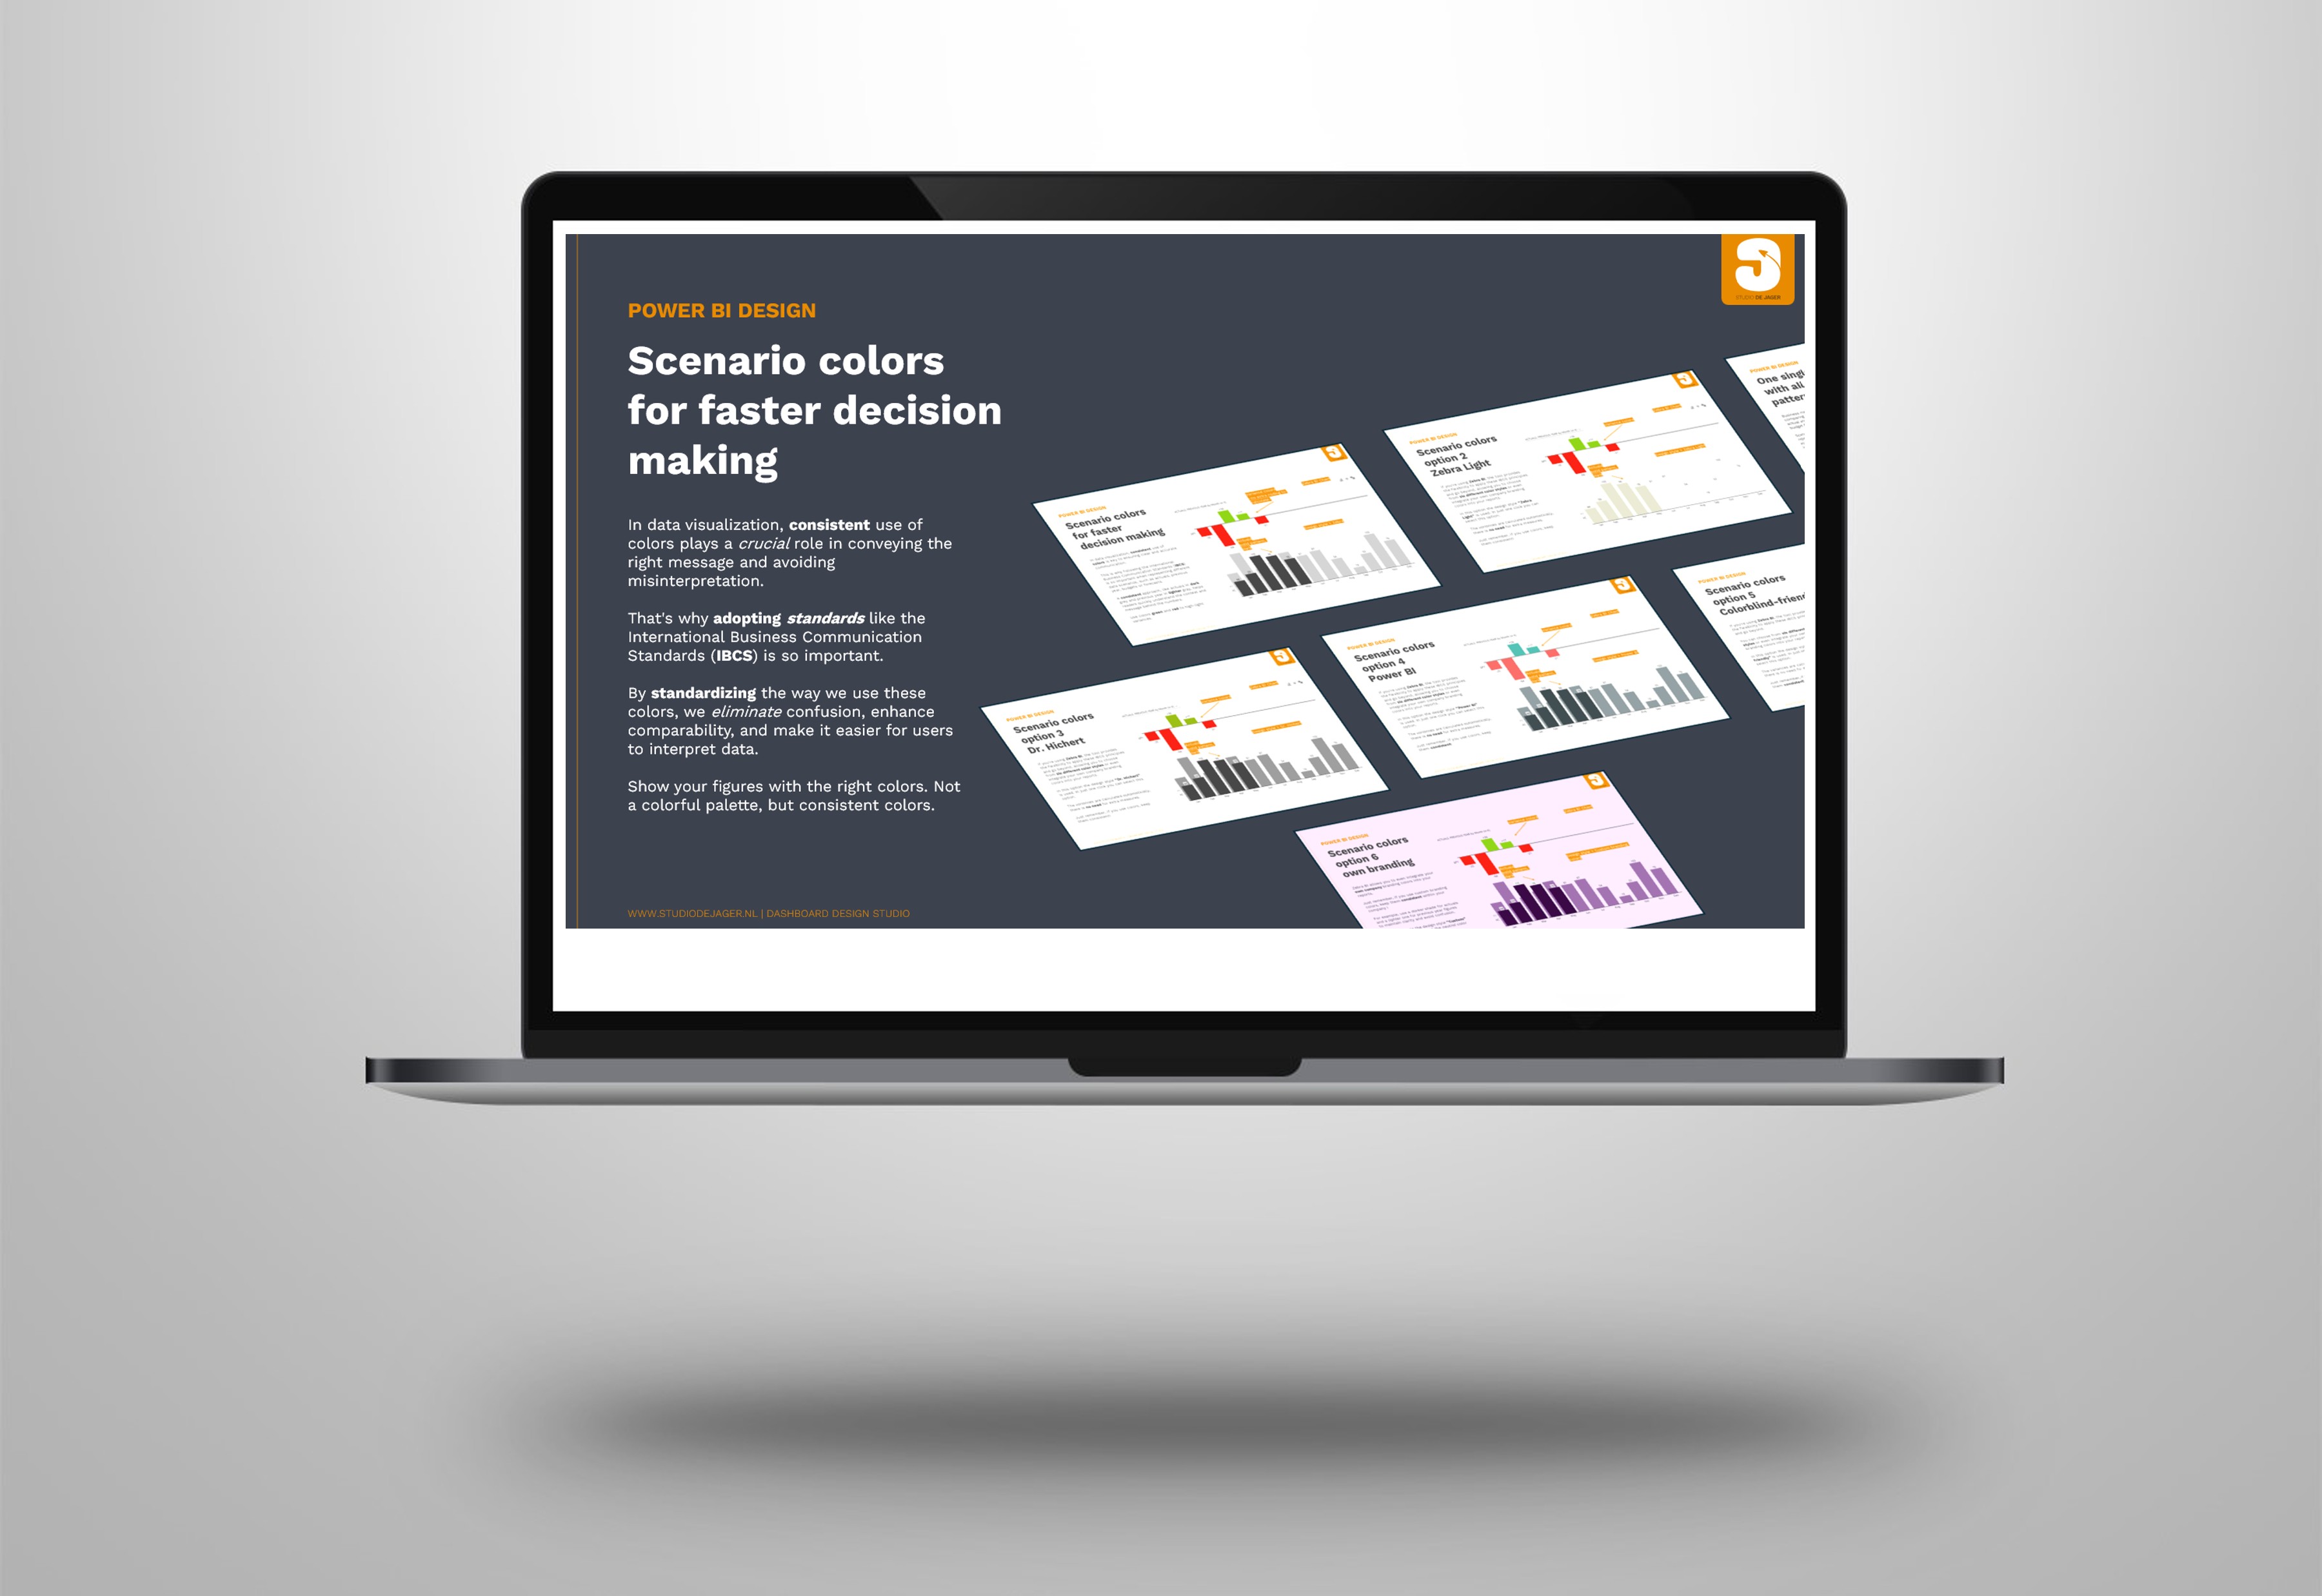
In data visualization, 𝐜𝐨𝐧𝐬𝐢𝐬𝐭𝐞𝐧𝐭 𝐮𝐬𝐞 𝐨𝐟 𝐜𝐨𝐥𝐨𝐫𝐬 is key to ensuring clear and accurate communication.
This is why following the IBCS – International Business Communication Standards is so important when representing different data scenarios, such as actuals, previous year, budgets, and forecasts.
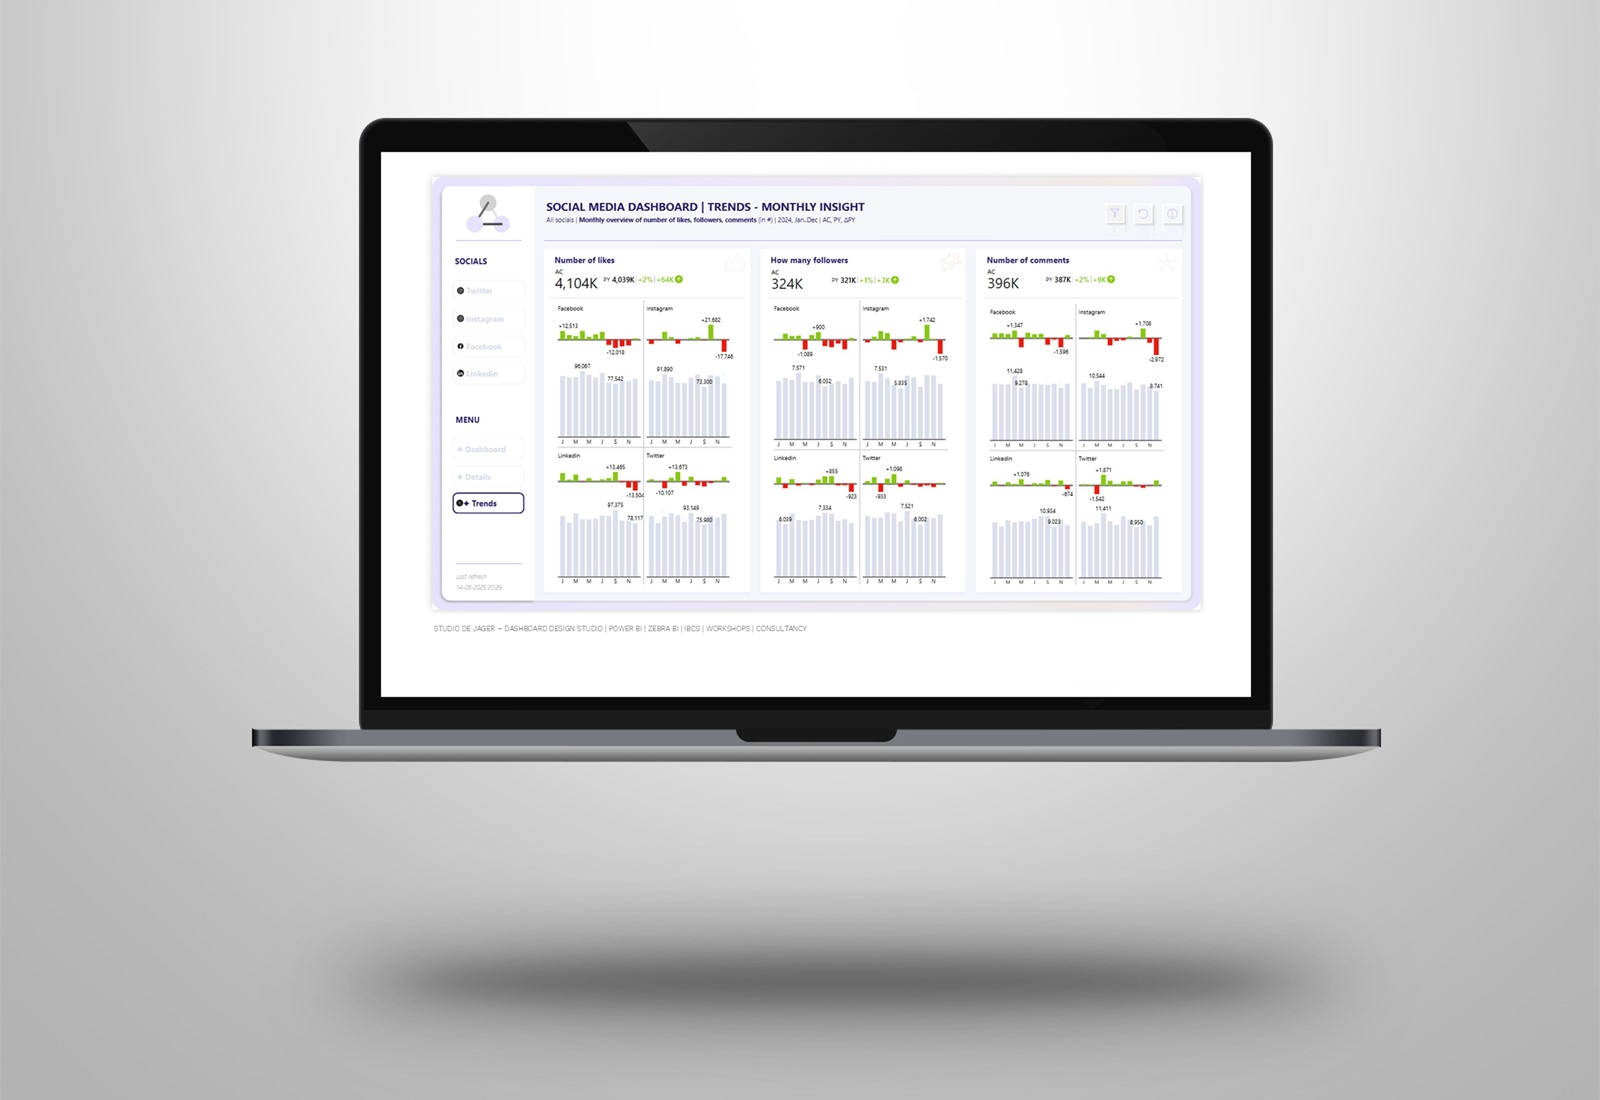
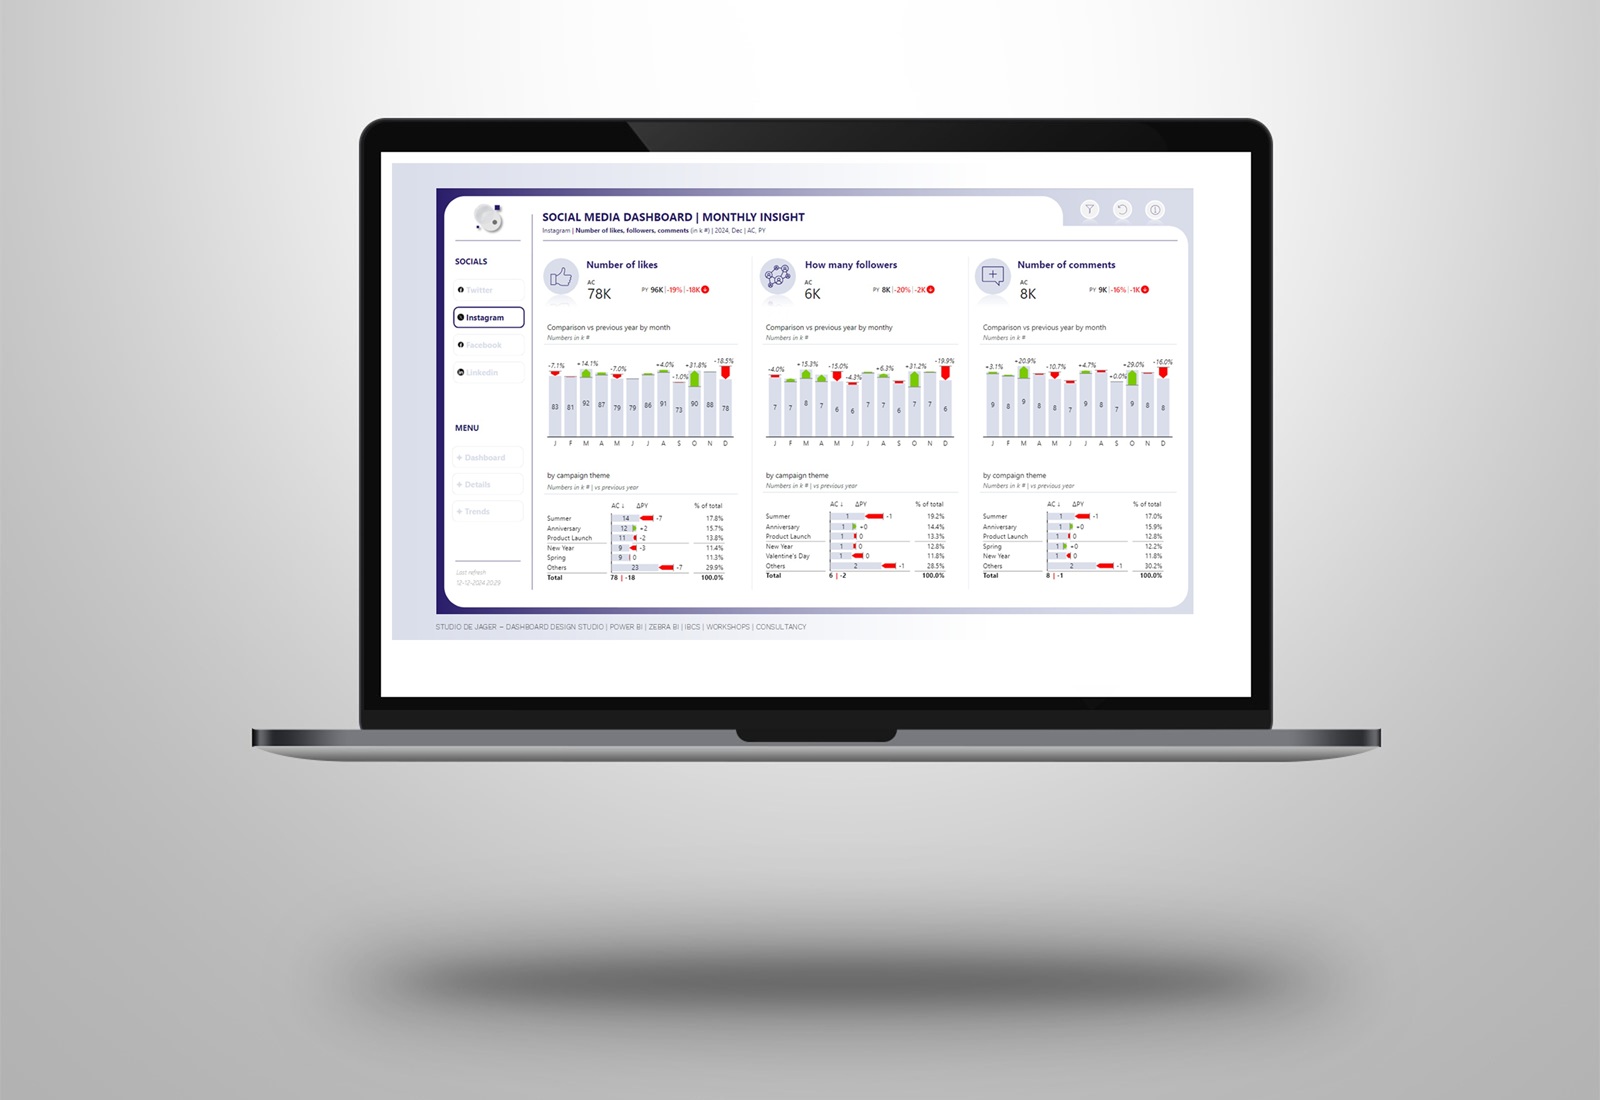
A 𝐜𝐨𝐧𝐬𝐢𝐬𝐭𝐞𝐧𝐭 𝐚𝐩𝐩𝐫𝐨𝐚𝐜𝐡, like actuals in dark grey and previous year in light gray, helps readers 𝐪𝐮𝐢𝐜𝐤𝐥𝐲 𝐮𝐧𝐝𝐞𝐫𝐬𝐭𝐚𝐧𝐝 𝐭𝐡𝐞 𝐜𝐨𝐧𝐭𝐞𝐱𝐭 and message behind the numbers.
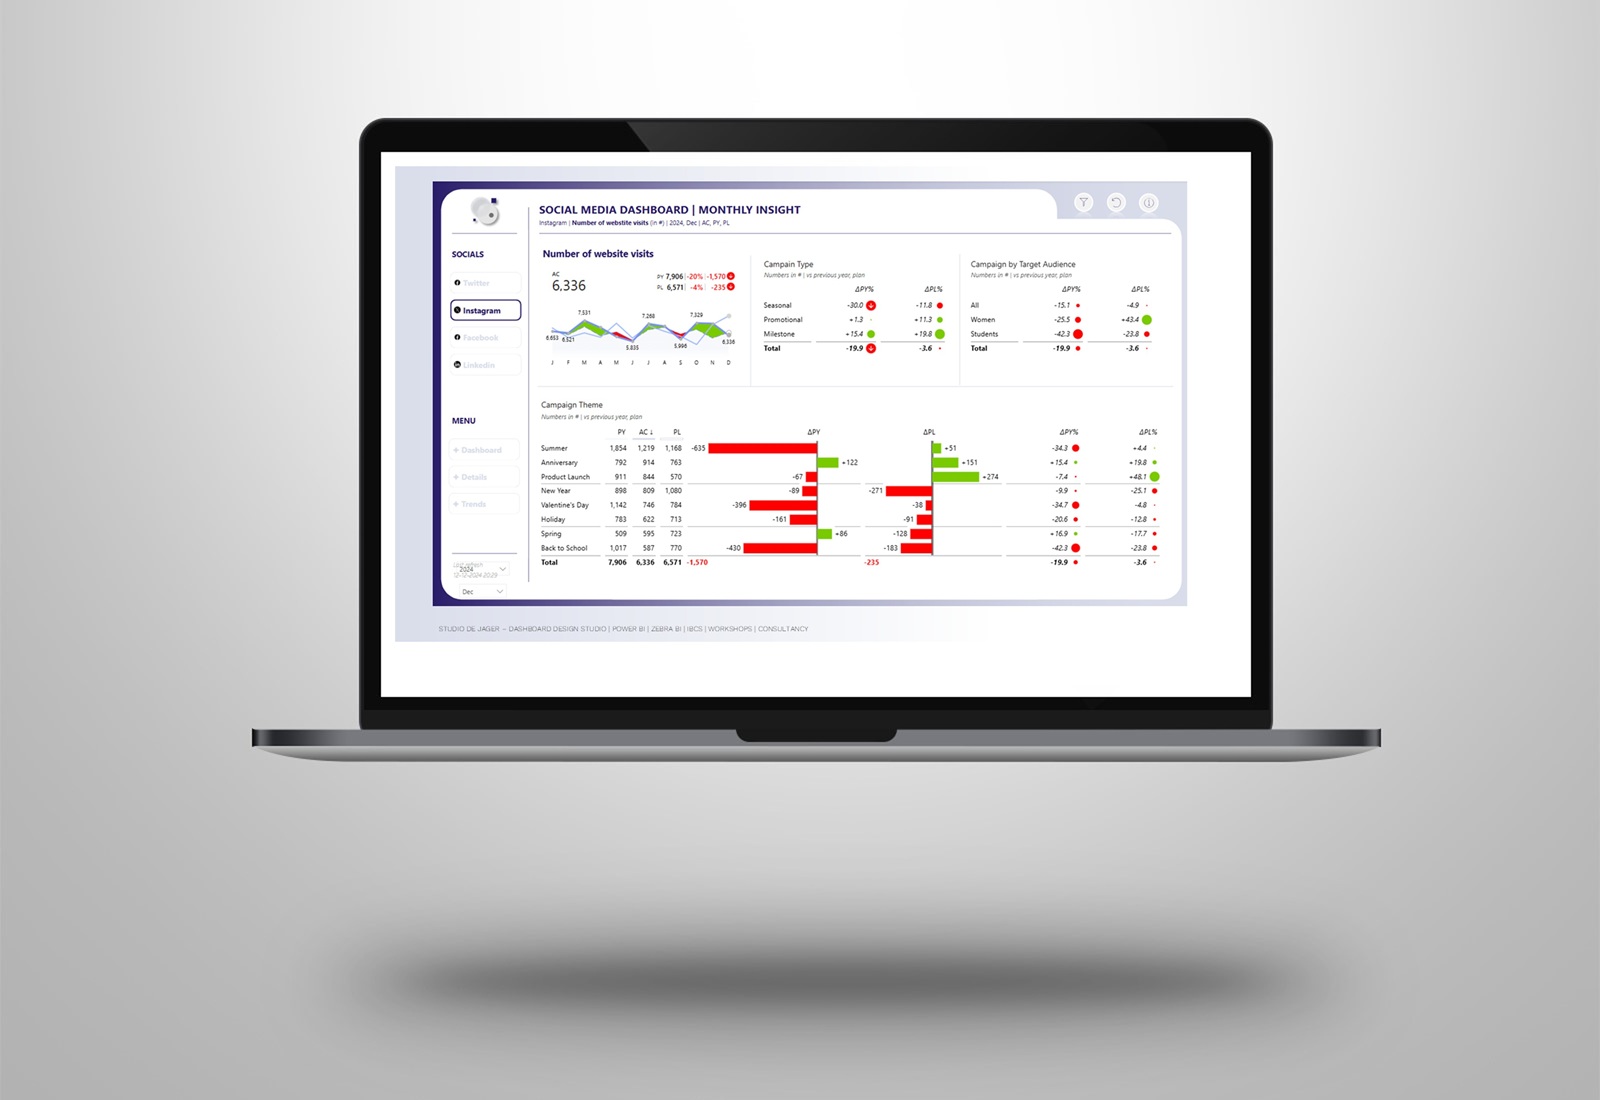
Use colors green and red to high-light variances.
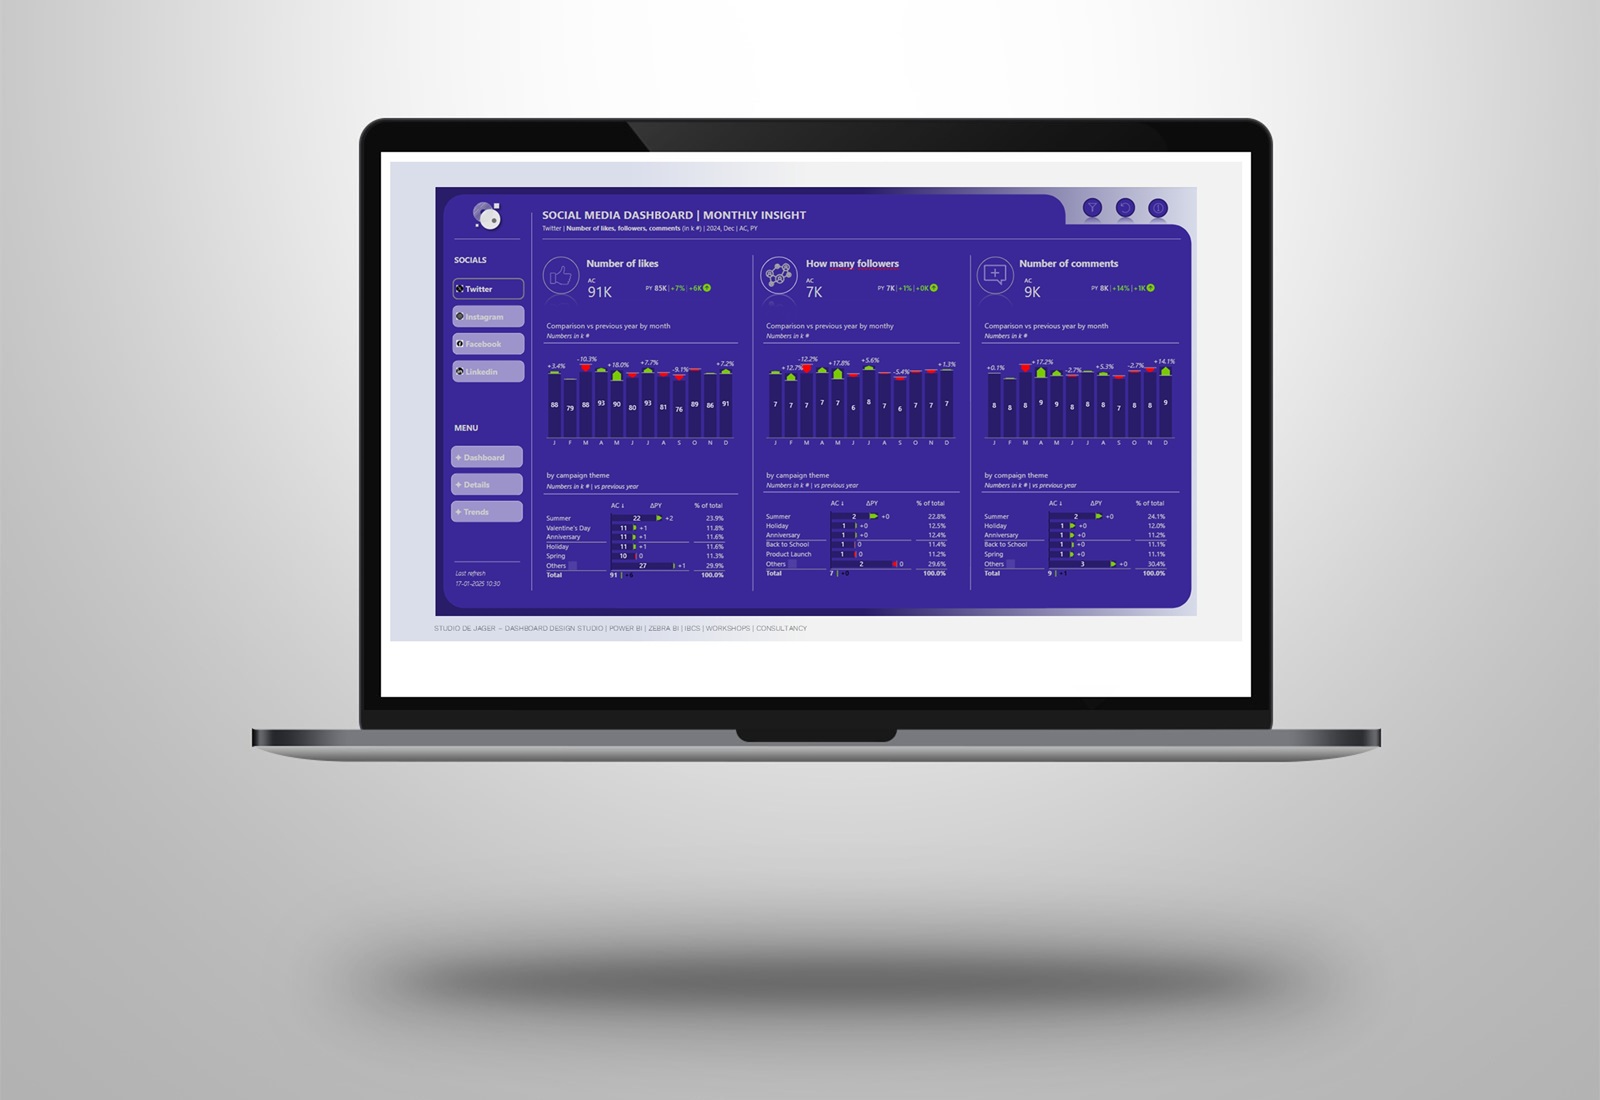
Zebra BI provides the flexibility to apply these IBCS – International Business Communication Standards principles and go beyond, allowing you to choose from six different color styles or even integrate your 𝘰𝘸𝘯 𝘤𝘰𝘮𝘱𝘢𝘯𝘺 𝘣𝘳𝘢𝘯𝘥𝘪𝘯𝘨 𝘤𝘰𝘭𝘰𝘳𝘴 into your reports.
Just remember, if you use custom branding colors, 𝐤𝐞𝐞𝐩 𝐭𝐡𝐞𝐦 𝐜𝐨𝐧𝐬𝐢𝐬𝐭𝐞𝐧𝐭!
𝘍𝘰𝘳 𝘦𝘹𝘢𝘮𝘱𝘭𝘦, 𝘶𝘴𝘦 𝘢 𝘥𝘢𝘳𝘬𝘦𝘳 𝘴𝘩𝘢𝘥𝘦 𝘧𝘰𝘳 𝘢𝘤𝘵𝘶𝘢𝘭𝘴 𝘢𝘯𝘥 𝘢 𝘭𝘪𝘨𝘩𝘵𝘦𝘳 𝘰𝘯𝘦 𝘧𝘰𝘳 𝘱𝘳𝘦𝘷𝘪𝘰𝘶𝘴 𝘺𝘦𝘢𝘳 𝘧𝘪𝘨𝘶𝘳𝘦𝘴 𝘵𝘰 𝘮𝘢𝘪𝘯𝘵𝘢𝘪𝘯 𝘤𝘭𝘢𝘳𝘪𝘵𝘺 𝘢𝘯𝘥 𝘢𝘷𝘰𝘪𝘥 𝘤𝘰𝘯𝘧𝘶𝘴𝘪𝘰𝘯.
By following these guidelines, you ensure that your reports stay visually coherent, increase trust in your data, and make it easier for stakeholders to focus on the insights rather than interpreting the visuals.
I prefer to follow the IBCS – International Business Communication Standards standards and use Zebra BI visuals in my Power BI reports.
Are your reports using scenario colors effectively?
studiodejager.nl | dashboard design studio
Report & dashboard design | Official Zebra BI Partner | Power BI | IBCS Certified | Data visualization | Interim business consultancy
Let’s create better reports & dashboards !