
𝐒𝐂𝐇𝐌𝐈𝐓𝐓𝐄𝐍 𝐃𝐀𝐒𝐇𝐁𝐎𝐀𝐑𝐃 - 𝐔𝐋𝐓𝐈𝐌𝐀𝐓𝐄 𝐒𝐊𝐈 𝐄𝐗𝐏𝐄𝐑𝐈𝐄𝐍𝐂𝐄 𝐃𝐄𝐒𝐈𝐆𝐍 I am thrilled to share with you an exciting new project I've been working on - the Schmitten Power BI dashboard! Inspired by the recent visit with my family to the Schmitten ski area in Austria, I've created this website-inspired dashboard that captures the essence of >> Lees verder
Power BI | Maven Analytics – Sales Challenge
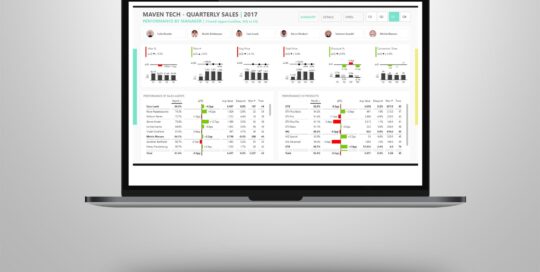
Sasja Jager, de2025-11-14T13:35:51+01:00I had some time this weekend to participate in the Maven Analytics sales challenge. The goal was to create an interactive Power BI dashboard that enables sales managers to track their team's quarterly performance. Used parts in the dashboard: 1. Zebra BI chart and table visuals 2. New Card visuals 3. New Slicer 4. For the >> Lees verder
Power BI | RAI data – dashboard makeover
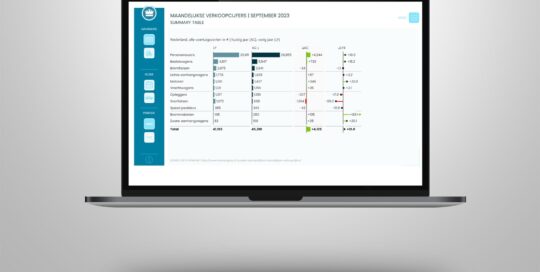
Sasja Jager, de2025-11-14T12:21:33+01:00I'm passionate about my work as a front-end Power BI consultant. I love to combine 𝘥𝘦𝘴𝘪𝘨𝘯 with 𝘢𝘤𝘵𝘪𝘰𝘯-𝘰𝘳𝘪𝘦𝘯𝘵𝘦𝘥 visuals from Zebra BI in Power BI and I'm a big fan of the IBCS – International Business Communication Standards. Recently I came across an online dashboard from the RAI Vereniging and I thought ...... there >> Lees verder
Power BI | Working capital dashboard with a Coolblue design
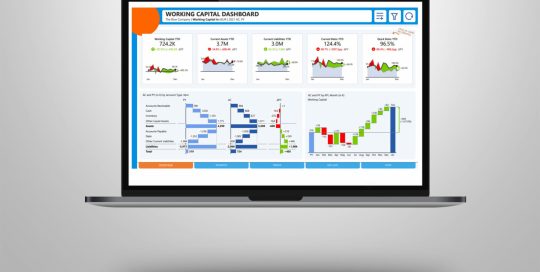
Sasja Jager, de2024-05-24T08:59:19+02:00Did you ever think of using IBCS standards to your Power BI dashboard? But …….. you think the IBCS colors (grey) are boring ……? Why not use your corporate identity and replace the colors by your own company colors? How does that look? I have created a Coolblue designed working capital report. In >> Lees verder
Power BI | Sonos product animation
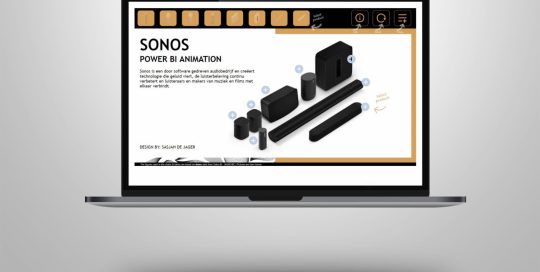
Sasja Jager, de2024-05-24T08:59:43+02:00How do you play your music, at home, at work or on the go? Since the early beginning I’m a big fan of the Sonos products for listening to music. Music gives a lot of happiness. With Sonos, you can connect the speakers to each other via your home network. This way you >> Lees verder
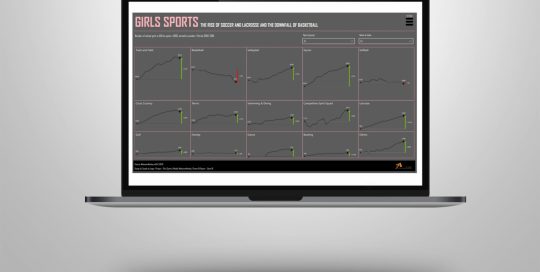
Power BI | Visualizing Girls Sports – makeover monday
Sasja Jager, de2024-05-24T09:00:07+02:00Visualizing Girls Sports The rise of soccer and lacrosse and the downfall of basketball. This week’s visualization is about the development of girls sports in the US which is part of MakeoverMonday week 24. Last couple of weeks I used Excel to do the visualizing but this time I choose Power BI because >> Lees verder
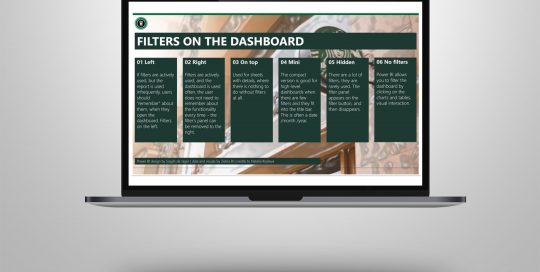
Power BI | filters on the dashboard with starbucks
Sasja Jager, de2023-01-25T18:43:30+01:00our expertise When designing a Power BI dashboard / report the use and placing of the filters can be a bit of a dilemma. Place the filters to the left, right, hide the filters ….. I read a post of Natalia Kiseleva in which she explained it in a very nice way, with >> Lees verder
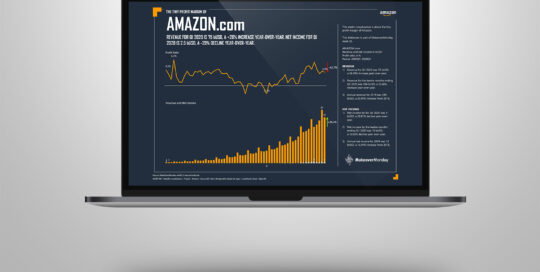
Visualizing the tiny profit margin of Amazon.com
Sasja Jager, de2021-03-18T11:57:08+01:00our expertise This week’s visualization is about the tiny profit margin of Amazon.com as part of MakeoverMonday week 25. This week I used the charts of Zebra BI to show the development of the revenue and the profit margin. As a difference to the original Viz I created a separate line chart with >> Lees verder