Power BI | Girls Sports - makeover monday
Visualizing Girls Sports
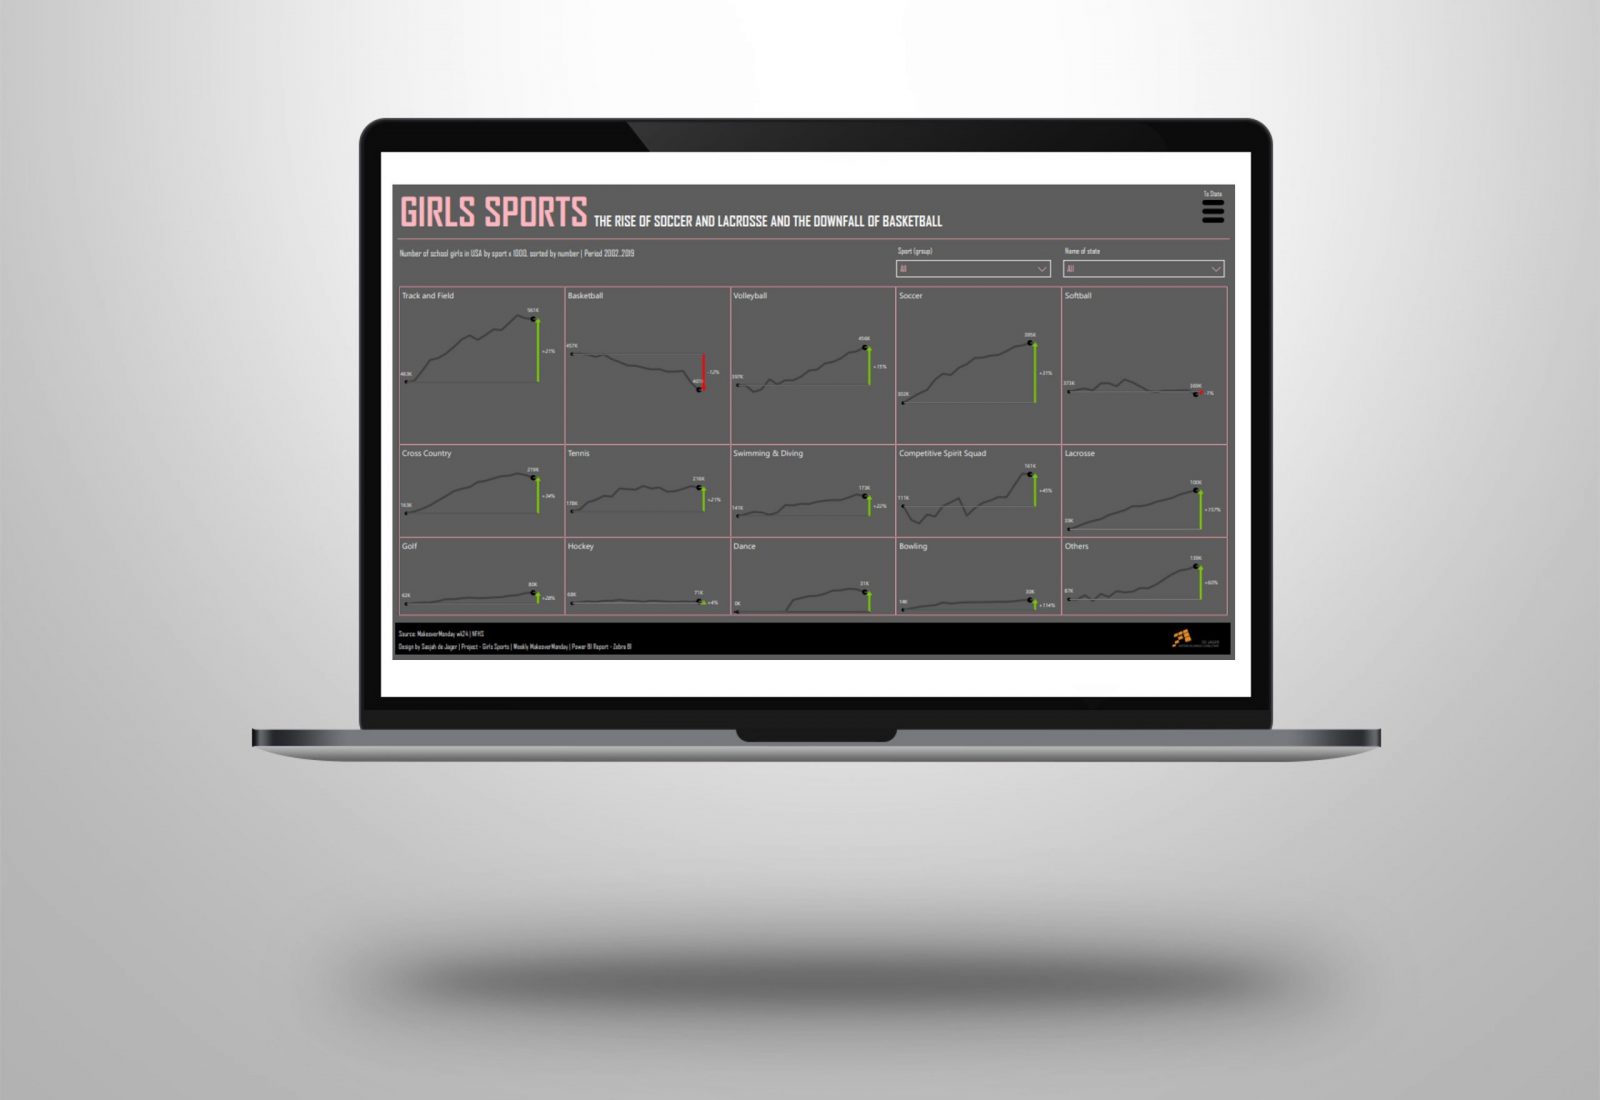
The rise of soccer and lacrosse and the downfall of basketball.
This week’s visualization is about the development of girls sports in the US which is part of MakeoverMonday week 24.
Last couple of weeks I used Excel to do the visualizing but this time I choose Power BI because of the nice and simple interactivity.
1) I used the Zebra BI custom visuals because they are ideal for this kind of comparisons. In one second you can create small multiples (structured and scaled).
2) Bookmarks and buttons to navigate through the pages.
3) Custom fonts in Power BI, json file with font Agency FB
4) Tooltip to show the sports within the US states and vice versa.
I’ve Made a short video with LOOM so you can watch it.
https://www.loom.com/share/0d764d8973e74c1eab931b968cdc947b
Have fun !
Weekly #visualization | Project #makeovermonday – Girls Sports | Designed by Sasjah de Jager | Used tools: #Power BI – #Zebra BI
