Power BI | Actionable reporting - part 11 – round your numbers & move units to the title
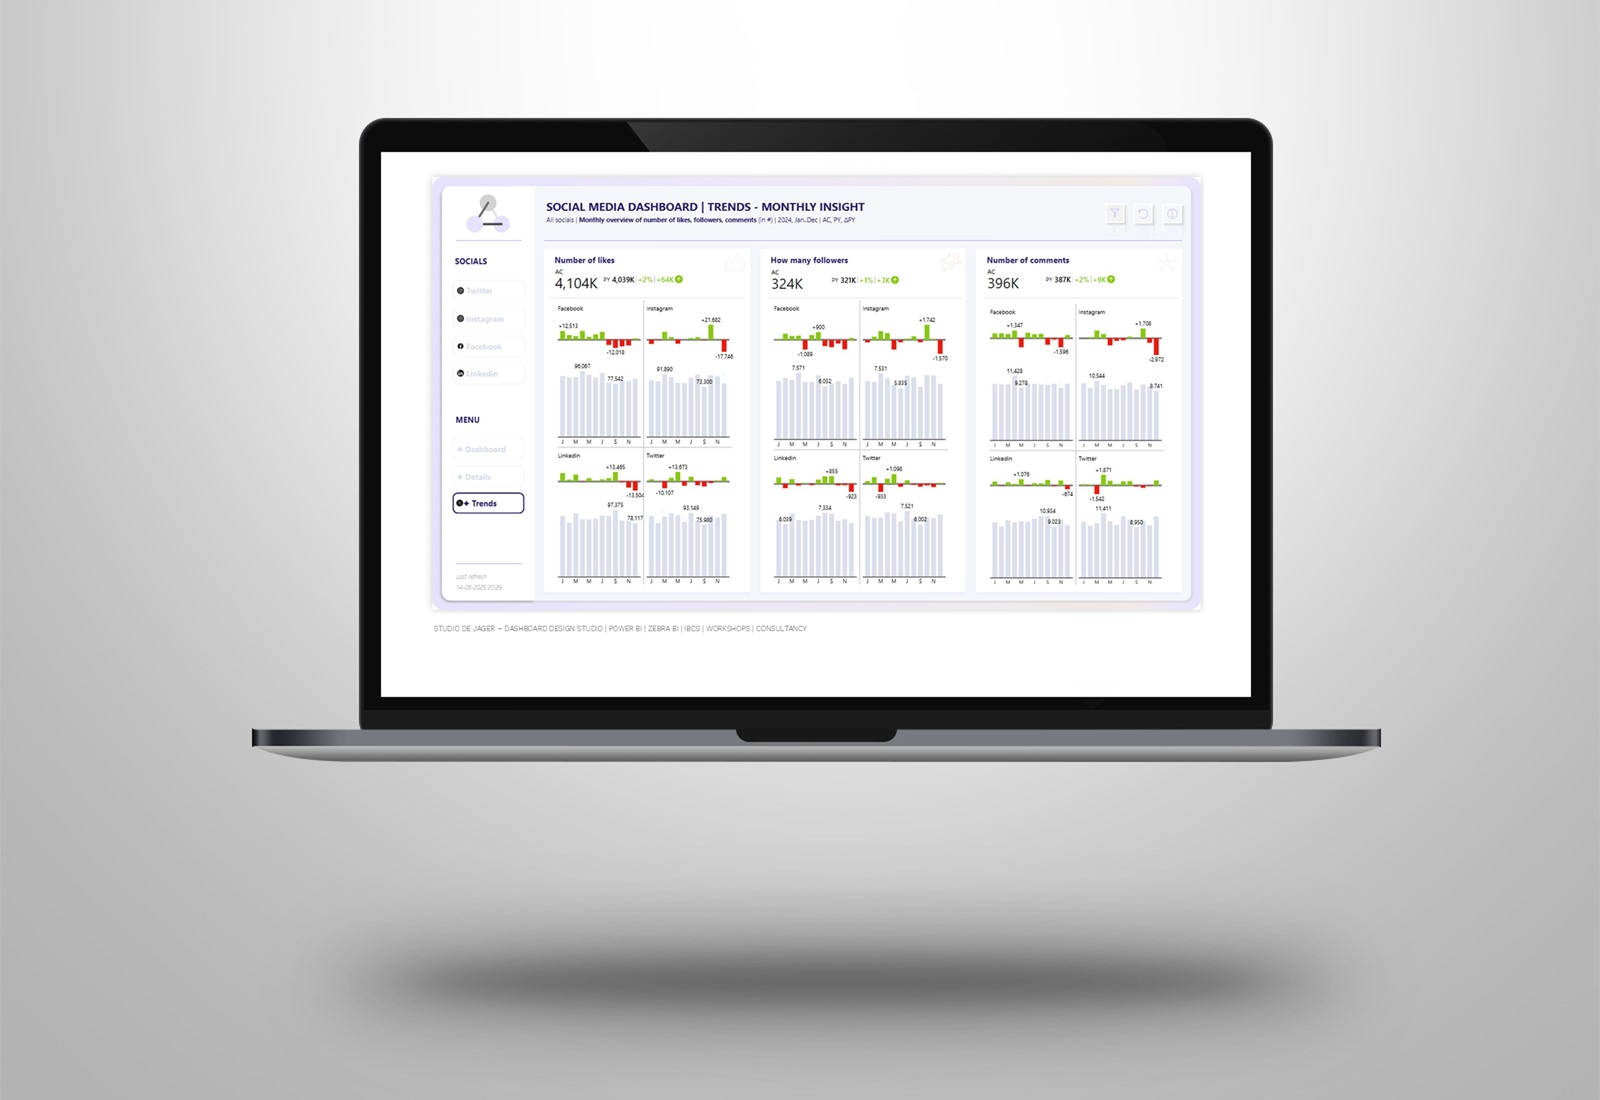
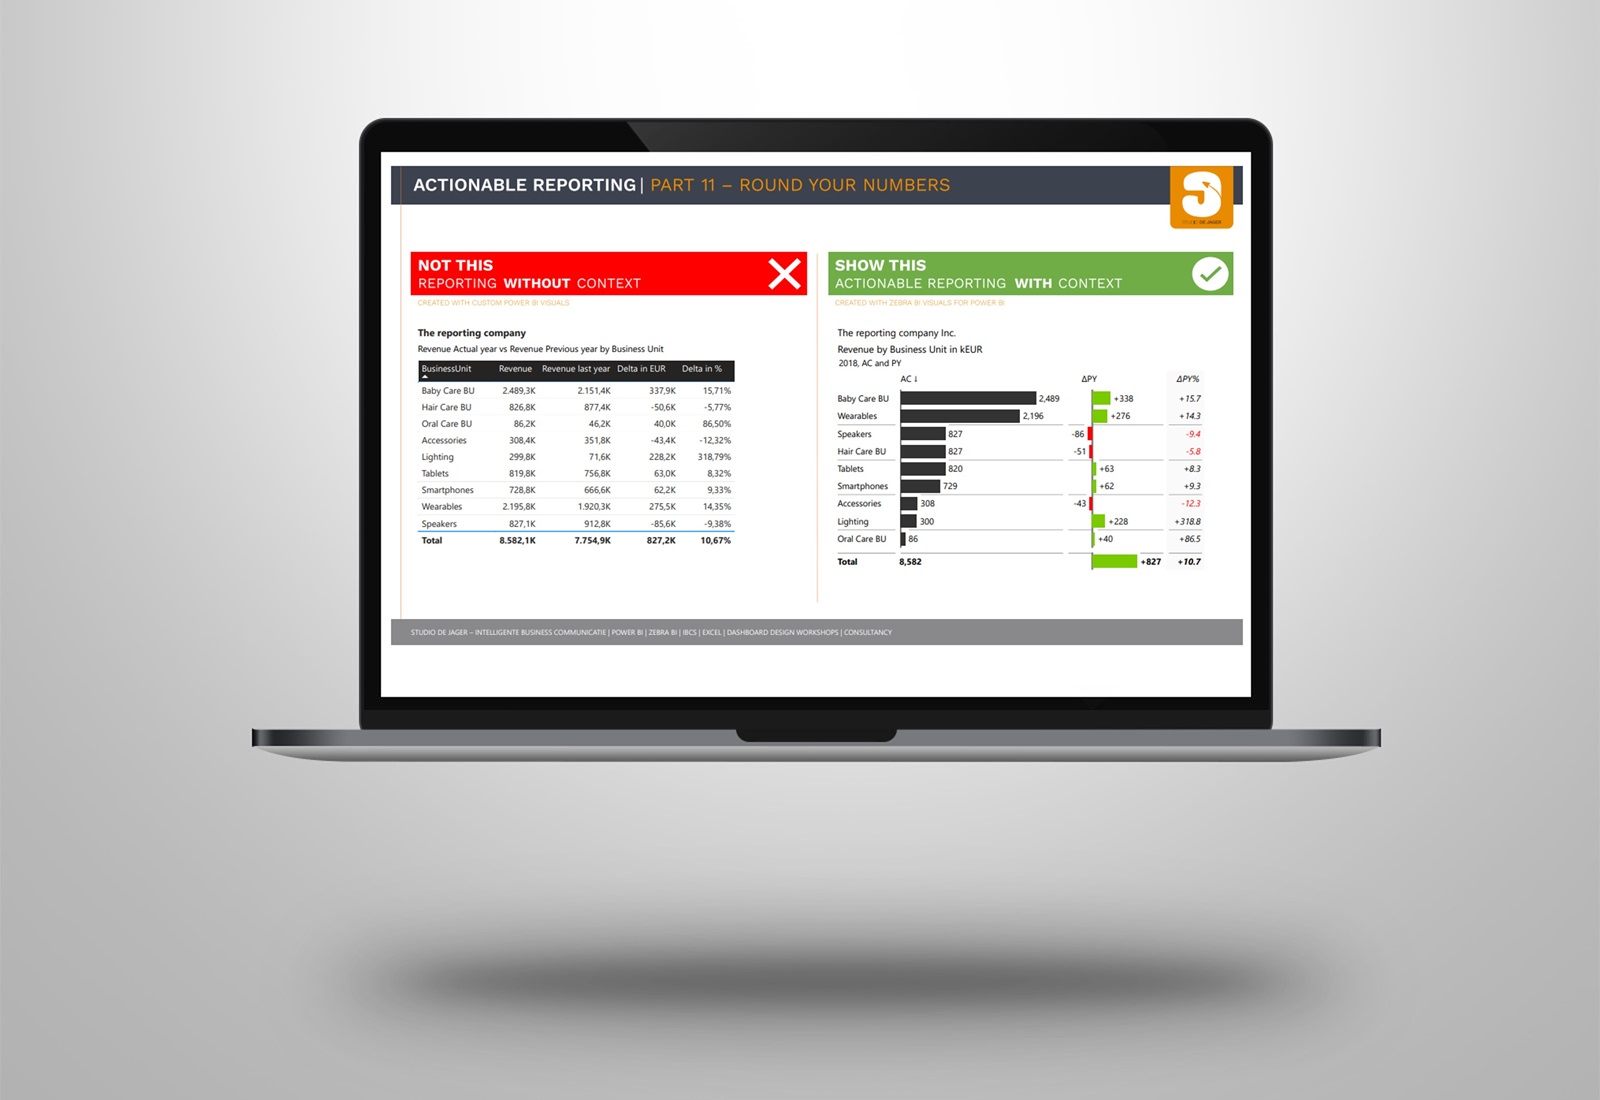
Too much detail in your visuals can distract from what’s really important. You don’t want your dashboard to be filled with large numbers, decimal places or showing measure units in your tables.
So don’t include more detailed precision than is necessary.
In today’s reality, creating reports that are just showing some numbers is not enough. Actionable Reporting is about getting insights fast: the faster you learn what’s happening with your performance, the faster you can decide what to do next.
When looking at a report visual, you should be able to tell right away if your performance.
Minor elements are generally not needed for telling your data story effectively.
A few tips to improve the readability of your visuals.
- Round numbers
- Show units in thousands (or millions)
- Show units in the (sub)title instead of Data labels
See the example of the Zebra BI table on the right where I rounded the number to thousands, moved the units to the title of the EUR and %. Much easier to read.
So let’s round your number!
Why using Zebra BI?
Zebra BI visuals were built to make reports and dashboards understandable and actionable.
- Easy to use without having to create extra measures
- Build reports 10x faster, get immediate visualization of your data
- Automatic applying of IBCS standards
- Increase in speed of analysis by +46%
- Improvement in decision accuracy by +61%
Need help with transforming your data into actionable reports? As an official Zebra BI partner we can help you with this.
studiodejager.nl | report & dashboard design studio
Report & dashboard design | Official Zebra BI Partner | Power BI – Excel | IBCS Certified Analyst | Data visualization | Interim business consultancy
Let’s create better reports & dashboards !