Power BI | Participating in Maven Railway Challenge
Last Maven Analytics challenge I had some problems with uploading my entry on time and unfortunately I couldn’t participate.
This time (Branislav Poljašević) I’m on time and I want to participate in the new challenge, the Maven Railway challenge. It’s my first challenge, so I’m going for the first-time entrant price ….. 😊
𝐎𝐛𝐣𝐞𝐜𝐭𝐢𝐯𝐞
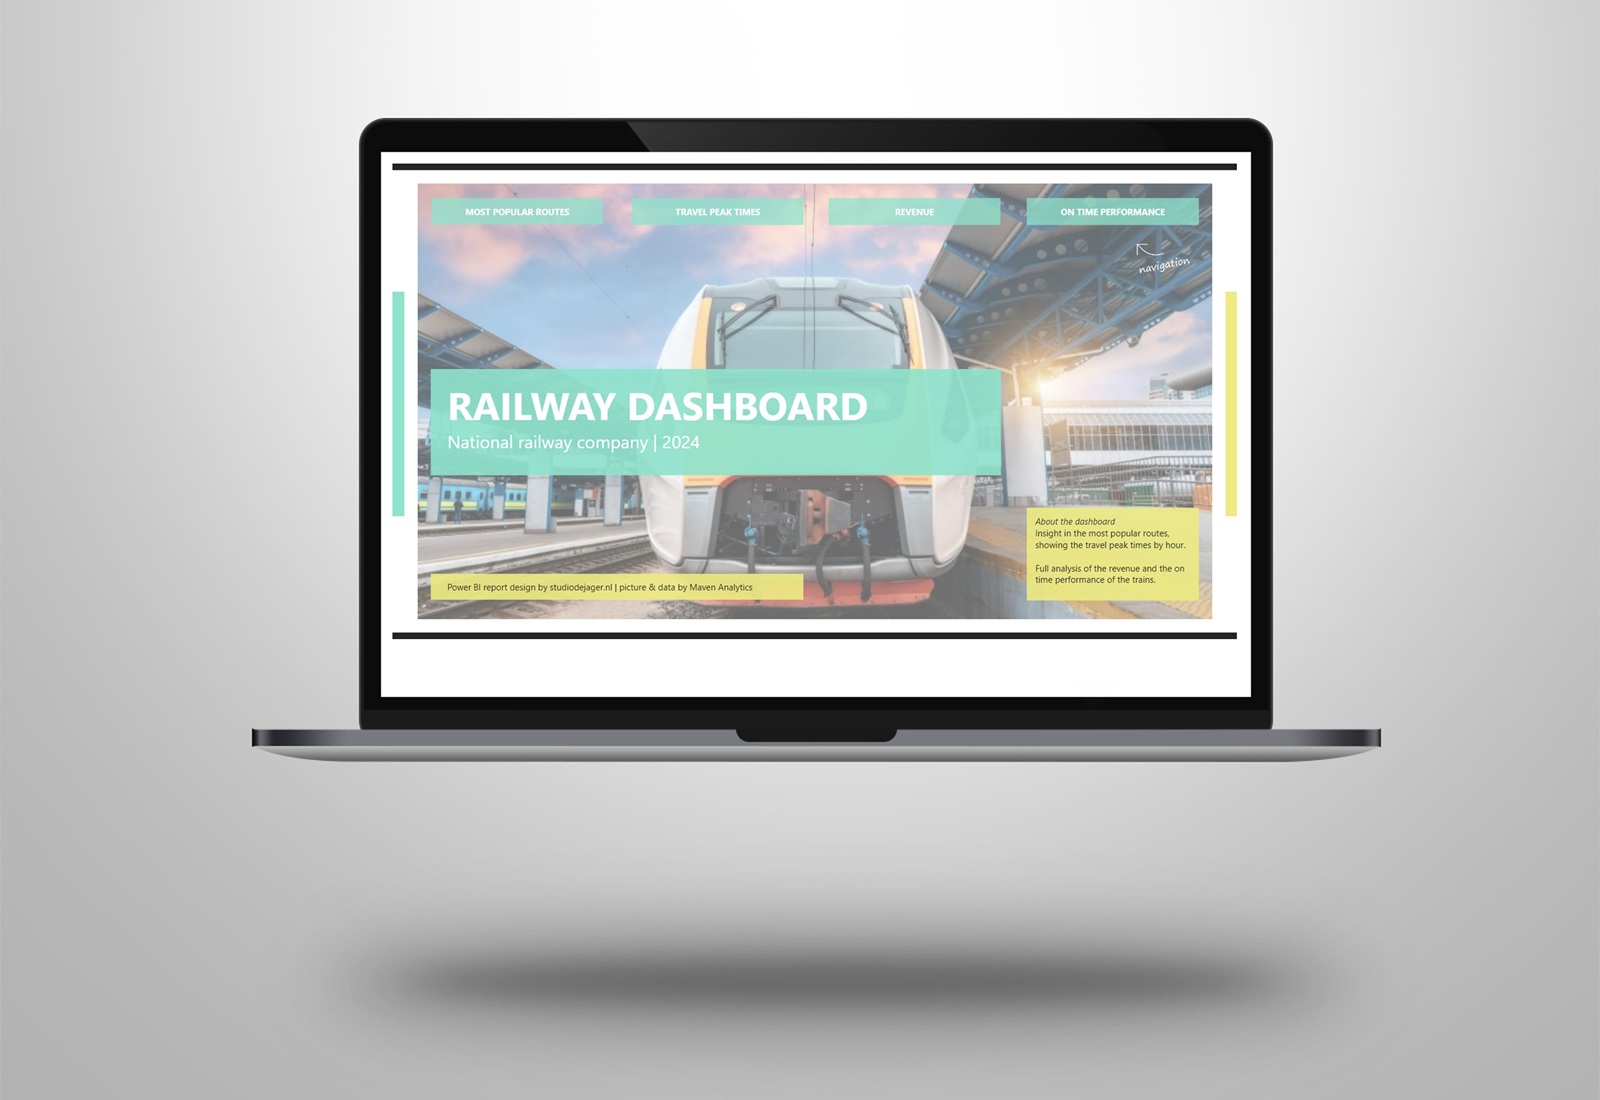
For the Maven Rail Challenge, we had to play the role of a BI Developer for National Rail, a company that provides business services to passenger train operators in England, Scotland, and Wales. We’ve been asked to create an exploratory 𝐏𝐨𝐰𝐞𝐫 𝐁𝐈 𝐝𝐚𝐬𝐡𝐛𝐨𝐚𝐫𝐝 that helps:
· Identify the most popular routes
· Determine peak travel times
· Analyze revenue from different ticket types & classes
· Diagnose on-time performance and contributing factors
Used parts in the dashboard:
1. Zebra BI charts and table visuals
2. Created a landing page with a moving background picture to make it a little bit more dynamic. Transformed the JPG into a SVG file and added some coding to make it dynamic.
3. For the heatmap I used the custom matrix visual
For the design I decided to keep it very clean and applied the colors of Maven Analytics very subtly in the dashboard. Used enough white space between the visuals, this is important for the readability of the dashboard. Same as the alignment of all the visual elements.
It was fun to participate and incorporate the above parts into the dashboard.
Hope you like it !
If you do, click on the project link below:
Sasjah de Jager
Report & dashboard design studio | Official Zebra BI Partner | Power BI – Excel | IBCS Certified Analyst | Data visualization | Interim business consultancy
Let’s create better reports & dashboards !
