Power BI | scenario patterns in your reports
𝐀𝐫𝐞 𝐲𝐨𝐮 𝐮𝐬𝐢𝐧𝐠 𝐬𝐜𝐞𝐧𝐚𝐫𝐢𝐨 𝐩𝐚𝐭𝐭𝐞𝐫𝐧𝐬 𝐢𝐧 𝐲𝐨𝐮𝐫 𝐫𝐞𝐩𝐨𝐫𝐭𝐬 ?
If not, you might be missing out on a powerful tool to enhance data clarity and communication.
In today’s data-driven world, 𝐜𝐥𝐞𝐚𝐫 𝐚𝐧𝐝 𝐞𝐟𝐟𝐞𝐜𝐭𝐢𝐯𝐞 communication of business metrics is critical. One powerful tool to achieve this is the 𝐮𝐬𝐞 𝐨𝐟 𝐬𝐜𝐞𝐧𝐚𝐫𝐢𝐨 𝐩𝐚𝐭𝐭𝐞𝐫𝐧𝐬, a key component of the IBCS – International Business Communication Standards framework.
So, what are scenario patterns and why should we care?
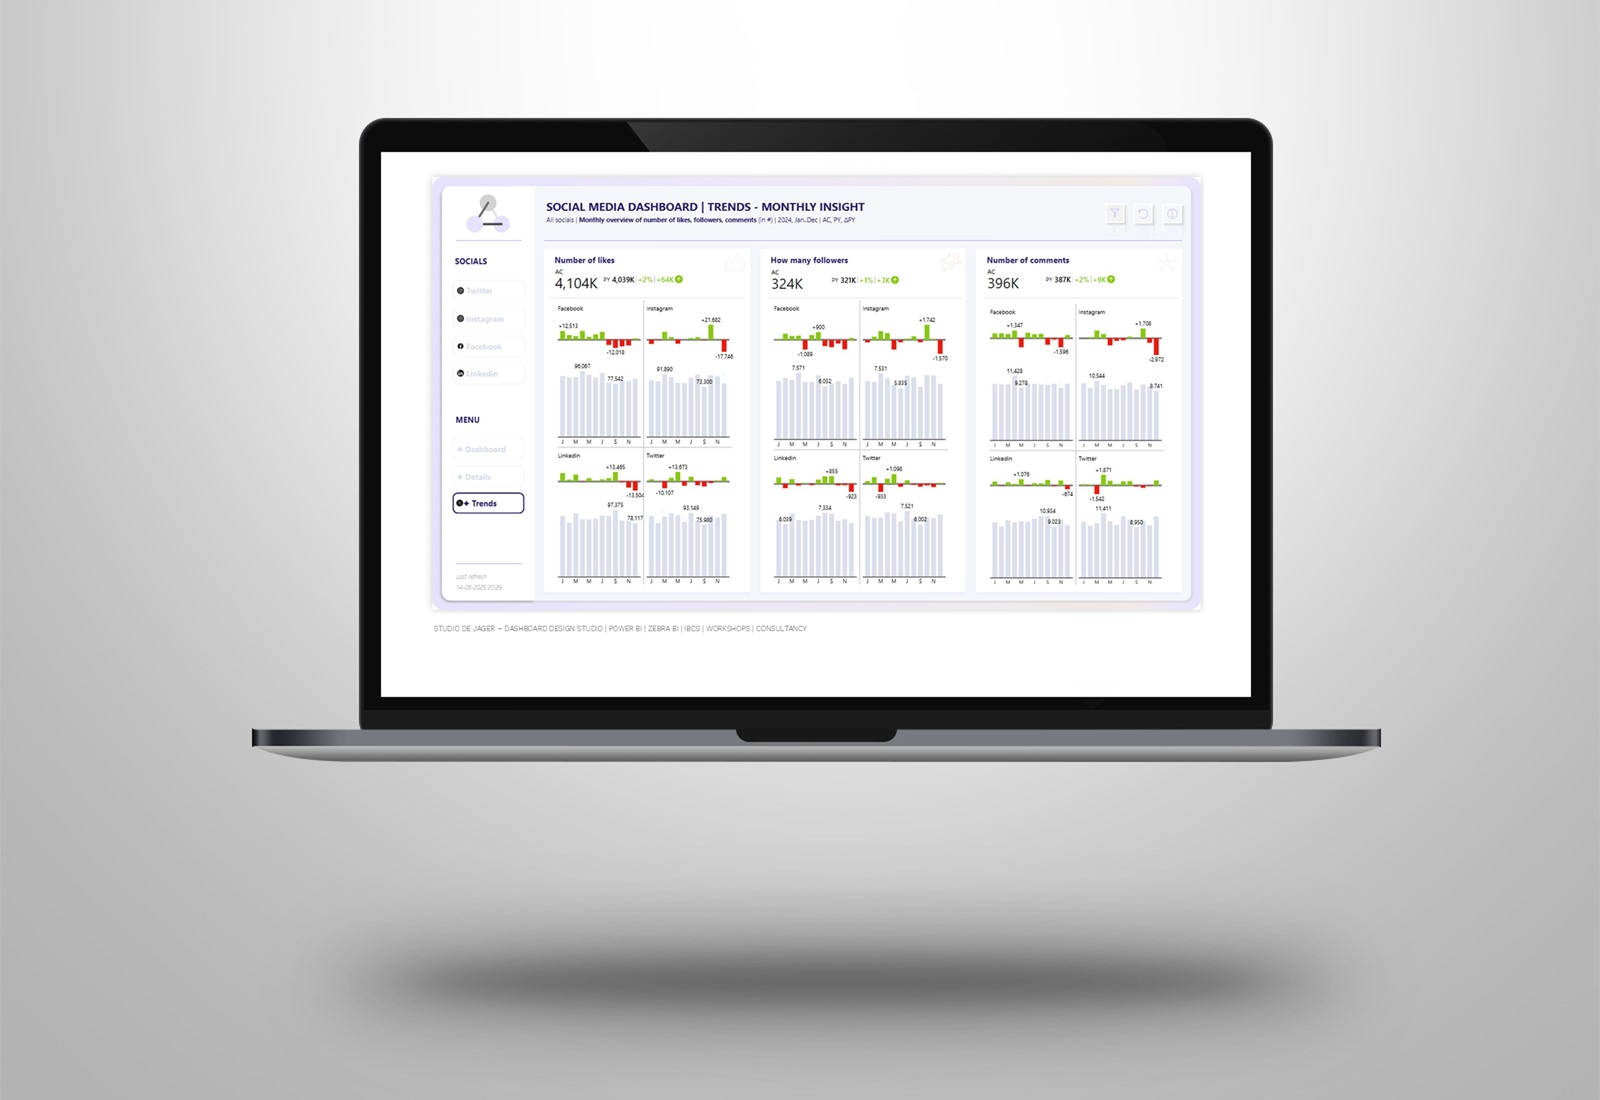
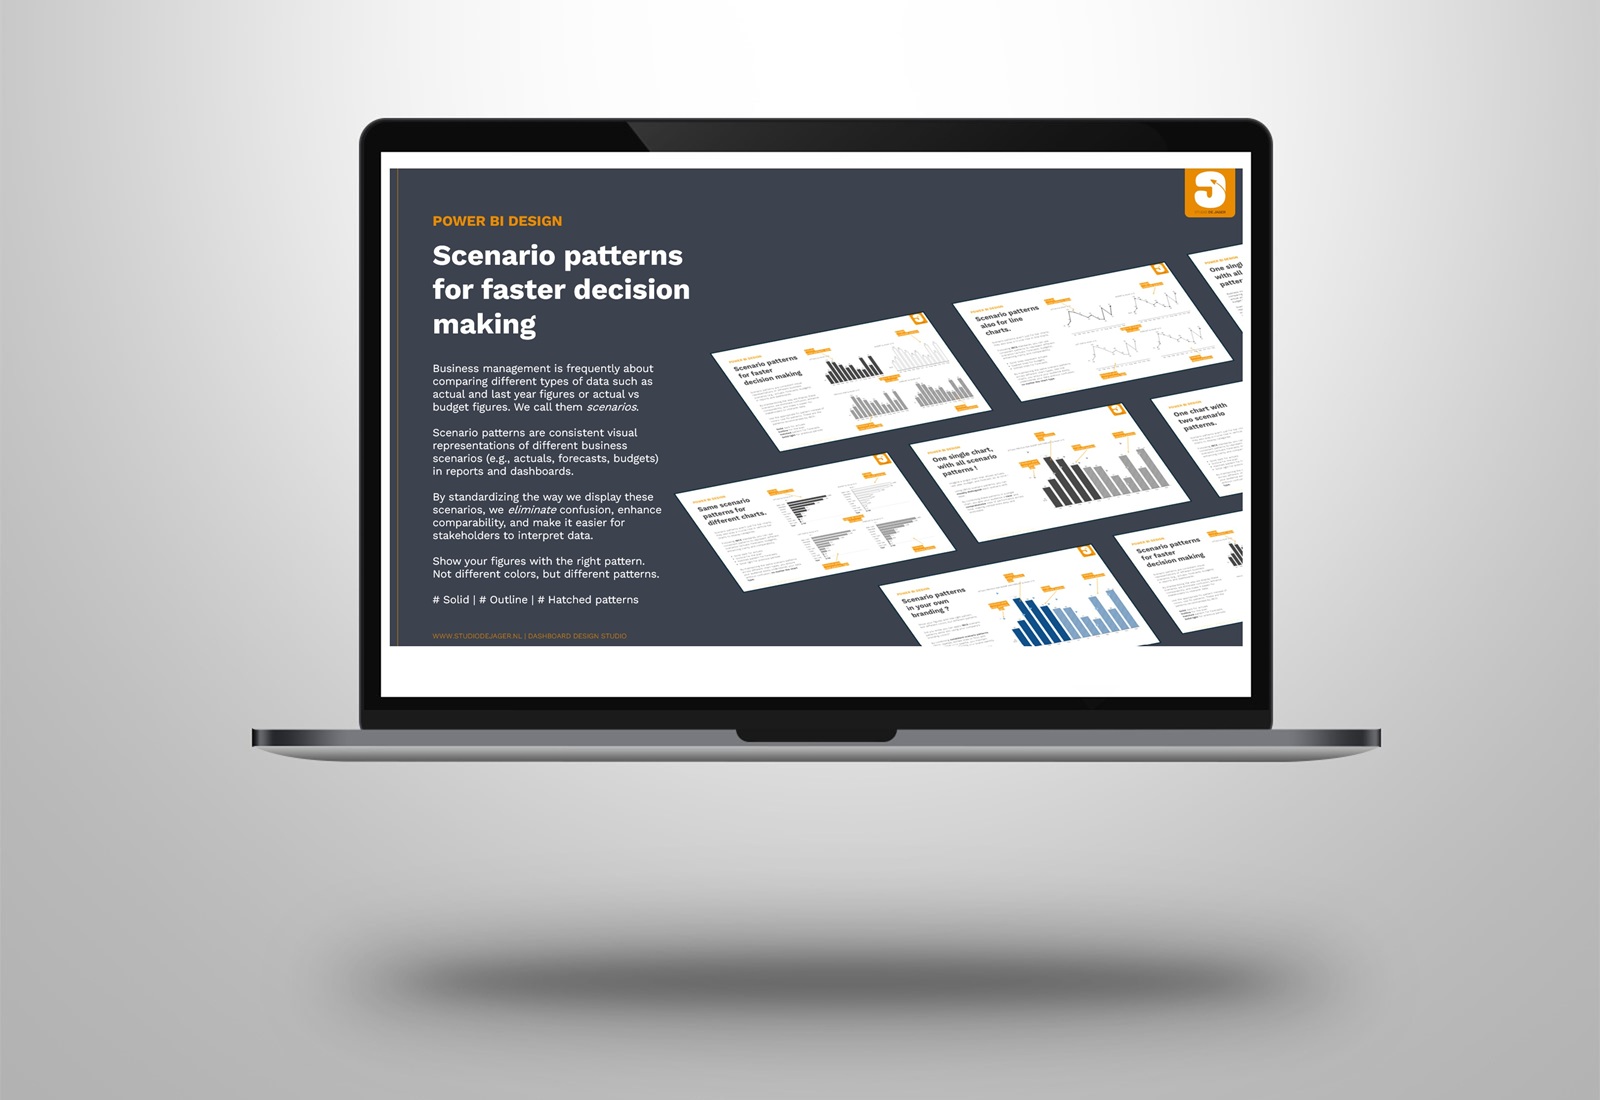
𝐒𝐜𝐞𝐧𝐚𝐫𝐢𝐨 𝐩𝐚𝐭𝐭𝐞𝐫𝐧𝐬 are consistent visual representations of different business scenarios (actuals, forecasts, budgets) in reports and dashboards. By standardizing the way we display these scenarios, we eliminate confusion, enhance comparability, and make it easier for stakeholders to interpret data.
Instead of colors, use fill patterns.
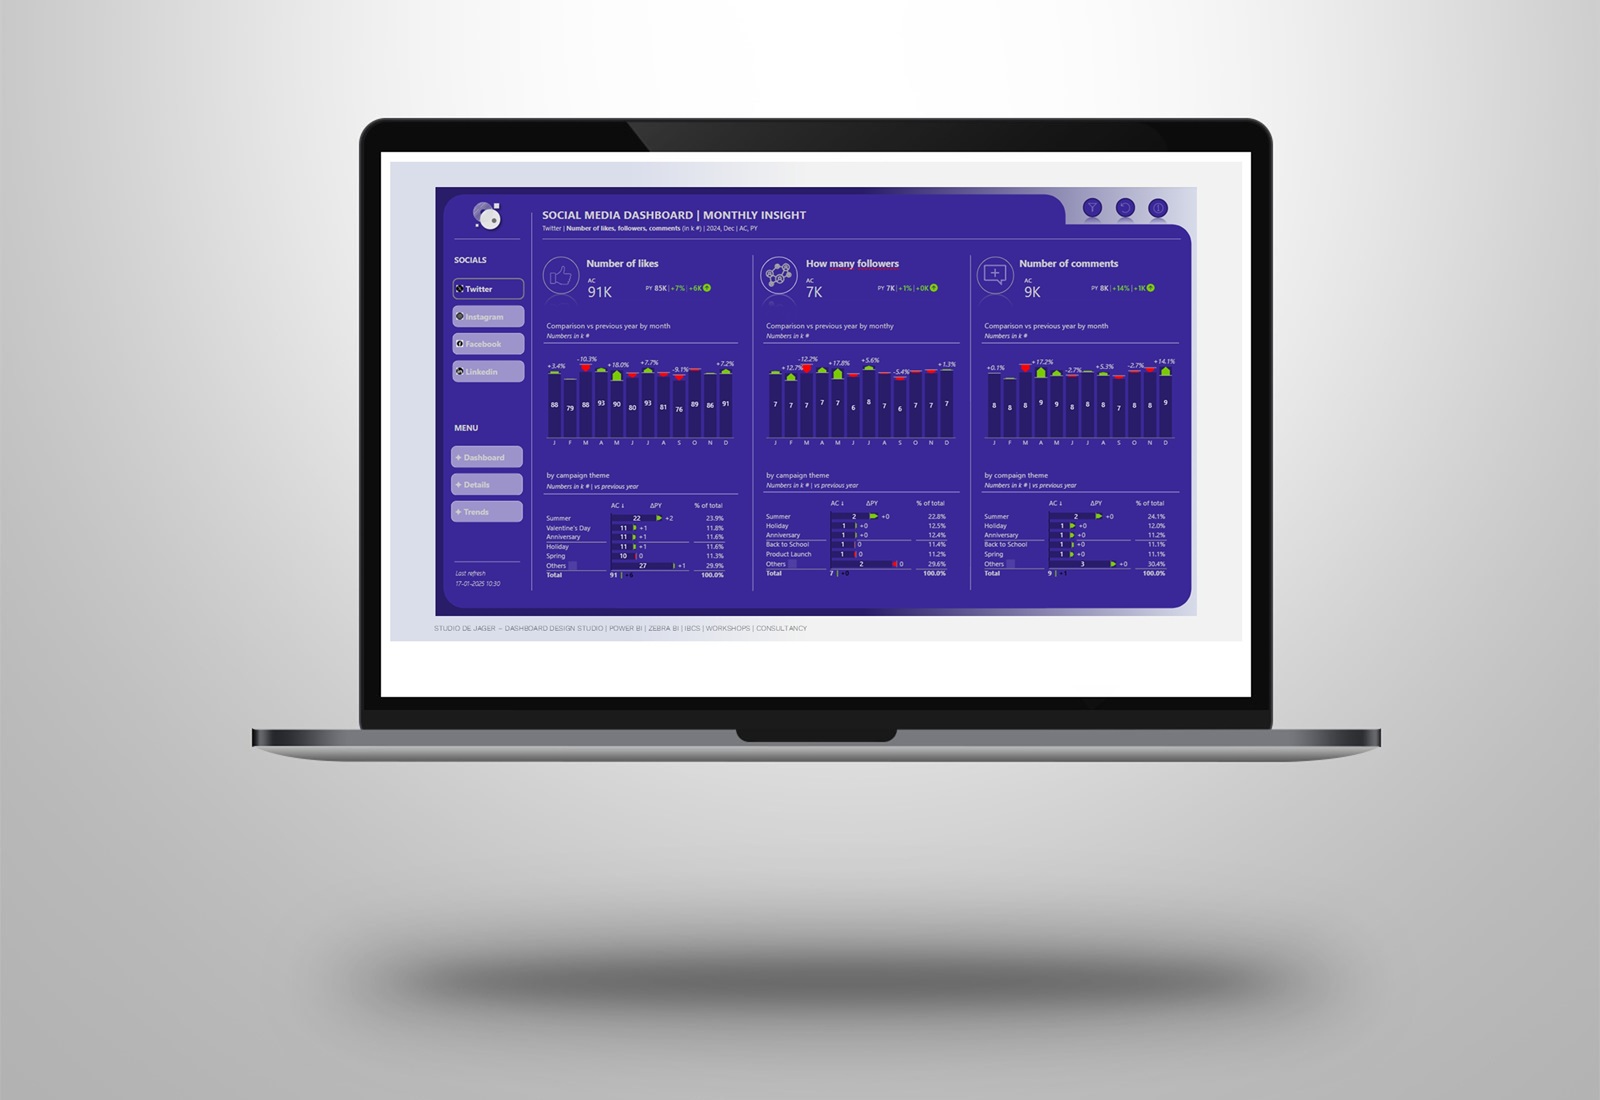
✅ 𝐒𝐨𝐥𝐢𝐝 𝐝𝐚𝐫𝐤 for actuals, solid light for previous periods
✅ 𝐎𝐮𝐭𝐥𝐢𝐧𝐞 for the plan
✅ 𝐇𝐚𝐭𝐜𝐡𝐞𝐝 pattern for forecasts
Here are some key benefits of using scenario patterns:
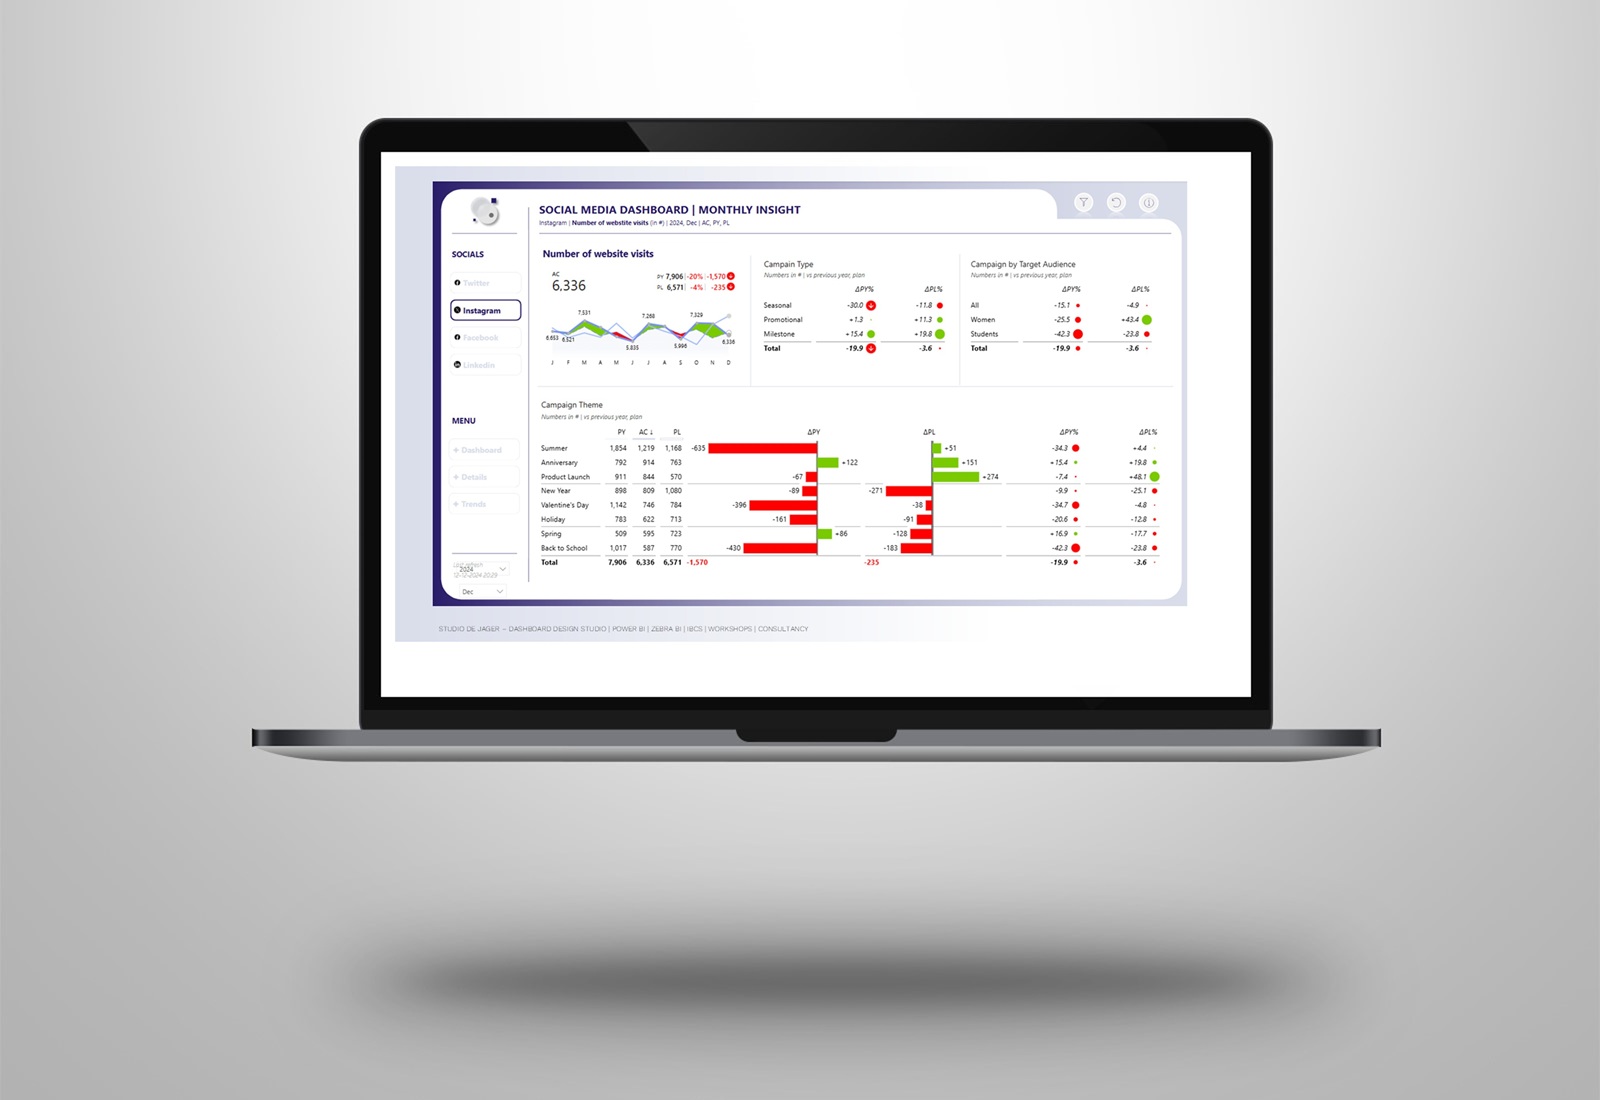
✅ Clarity and consistency: With scenario patterns, whether it’s a forecast, actual performance, or a budget, every viewer immediately recognizes the context without explanation. 𝐓𝐡𝐢𝐬 𝐥𝐞𝐚𝐝𝐬 𝐭𝐨 𝐟𝐚𝐬𝐭𝐞𝐫 𝐝𝐞𝐜𝐢𝐬𝐢𝐨𝐧-𝐦𝐚𝐤𝐢𝐧𝐠 𝐚𝐧𝐝 𝐟𝐞𝐰𝐞𝐫 𝐦𝐢𝐬𝐮𝐧𝐝𝐞𝐫𝐬𝐭𝐚𝐧𝐝𝐢𝐧𝐠𝐬.
✅ Visual hierarchy: IBCS prescribes specific design rules, such as using different line types, fills, and shades to distinguish between actuals, plans, and forecasts. 𝐓𝐡𝐢𝐬 𝐰𝐚𝐲, 𝐬𝐭𝐚𝐤𝐞𝐡𝐨𝐥𝐝𝐞𝐫𝐬 𝐜𝐚𝐧 𝐞𝐚𝐬𝐢𝐥𝐲 𝐢𝐝𝐞𝐧𝐭𝐢𝐟𝐲 𝐰𝐡𝐢𝐜𝐡 𝐟𝐢𝐠𝐮𝐫𝐞𝐬 𝐚𝐫𝐞 𝐛𝐚𝐬𝐞𝐝 𝐨𝐧 𝐩𝐥𝐚𝐧𝐧𝐢𝐧𝐠 𝐯𝐬. 𝐫𝐞𝐚𝐥-𝐰𝐨𝐫𝐥𝐝 𝐨𝐮𝐭𝐜𝐨𝐦𝐞𝐬.
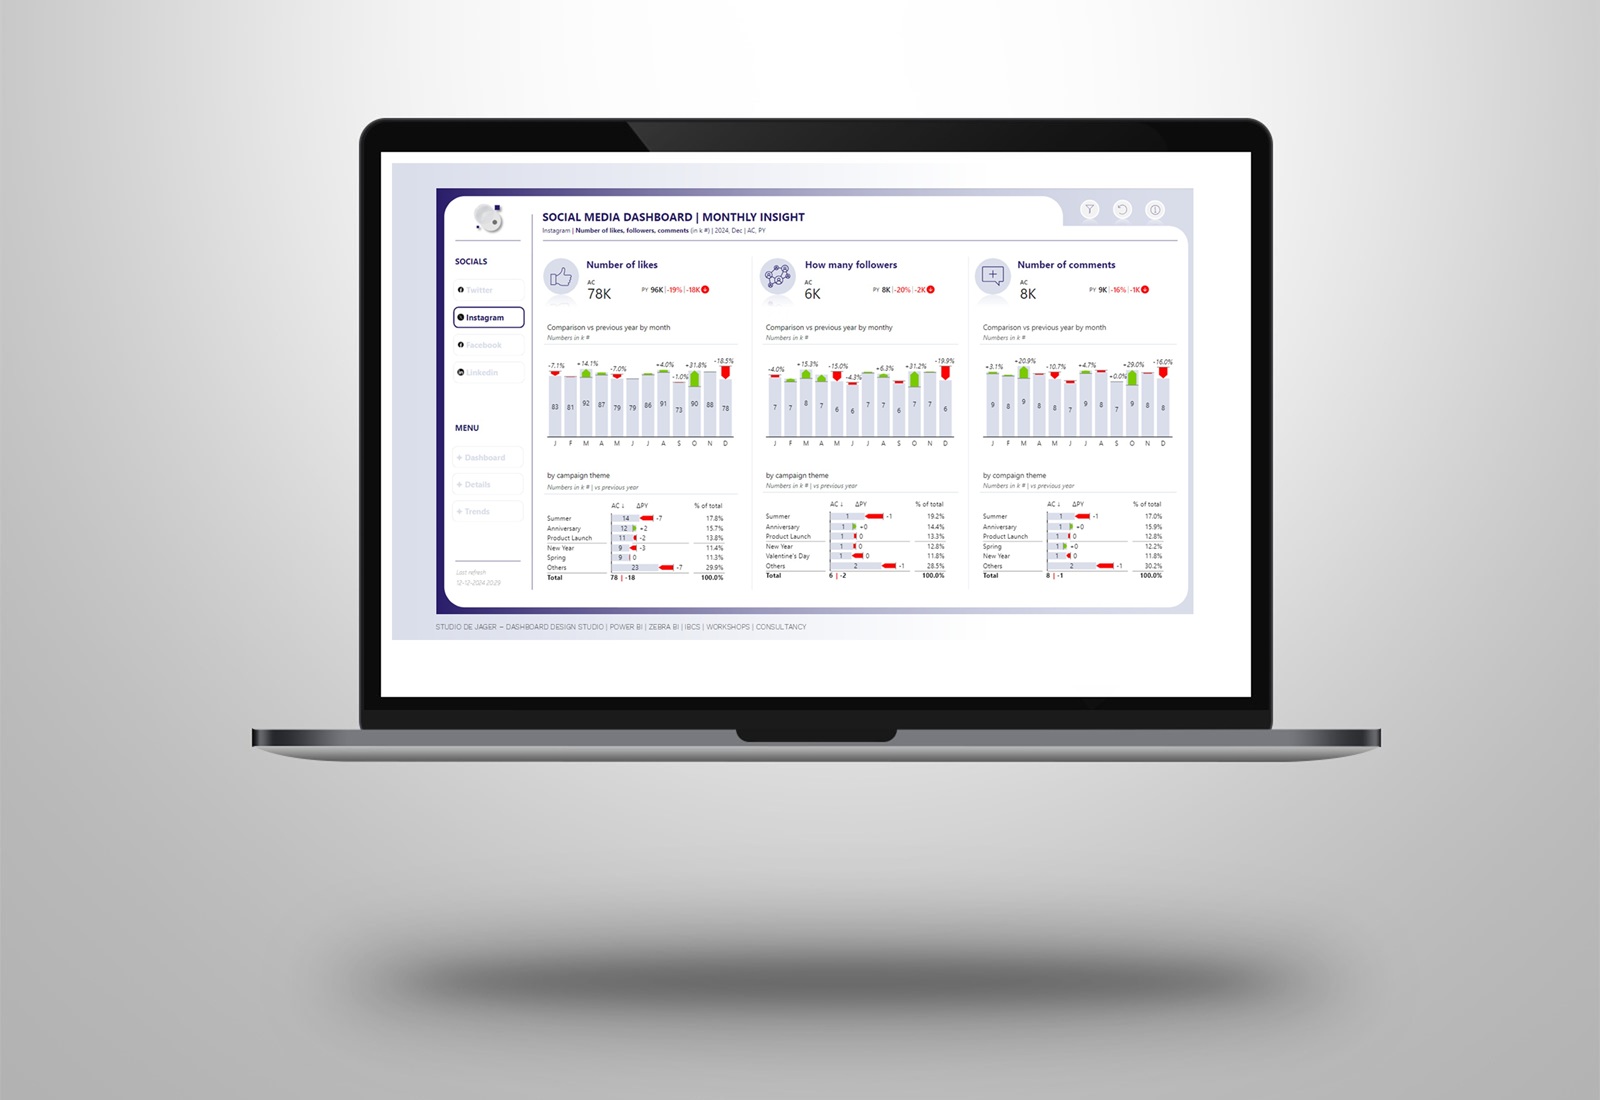
✅ Improved comparability: When we apply consistent patterns across reports, comparing different time periods, scenarios, or projects becomes much easier. 𝐍𝐨 𝐦𝐨𝐫𝐞 𝐠𝐮𝐞𝐬𝐬𝐢𝐧𝐠 𝐰𝐡𝐞𝐭𝐡𝐞𝐫 𝐲𝐨𝐮’𝐫𝐞 𝐥𝐨𝐨𝐤𝐢𝐧𝐠 𝐚𝐭 𝐚 𝐛𝐮𝐝𝐠𝐞𝐭 𝐨𝐫 𝐚𝐜𝐭𝐮𝐚𝐥 𝐟𝐢𝐠𝐮𝐫𝐞𝐬!
✅ International Standardization: IBCS is used globally, which makes your reports more accessible to an international audience. By aligning with these standards, 𝐲𝐨𝐮 𝐞𝐧𝐬𝐮𝐫𝐞 𝐭𝐡𝐚𝐭 𝐬𝐭𝐚𝐤𝐞𝐡𝐨𝐥𝐝𝐞𝐫𝐬 𝐟𝐫𝐨𝐦 𝐝𝐢𝐟𝐟𝐞𝐫𝐞𝐧𝐭 𝐛𝐚𝐜𝐤𝐠𝐫𝐨𝐮𝐧𝐝𝐬 𝐜𝐚𝐧 𝐢𝐧𝐭𝐞𝐫𝐩𝐫𝐞𝐭 𝐲𝐨𝐮𝐫 𝐝𝐚𝐭𝐚 𝐢𝐧 𝐚 𝐮𝐧𝐢𝐟𝐢𝐞𝐝 𝐦𝐚𝐧𝐧𝐞𝐫.
Incorporating scenario patterns in your data reporting doesn’t just improve aesthetics, it enhances understanding, speed, and efficiency.
Are you using scenario patterns? Love to hear your thoughts!
studiodejager.nl | dashboard design studio
Report & dashboard design | Official Zebra BI Partner | IBCS Certified Analyst | Data visualization | Interim business consultancy
Let’s create better reports & dashboards !