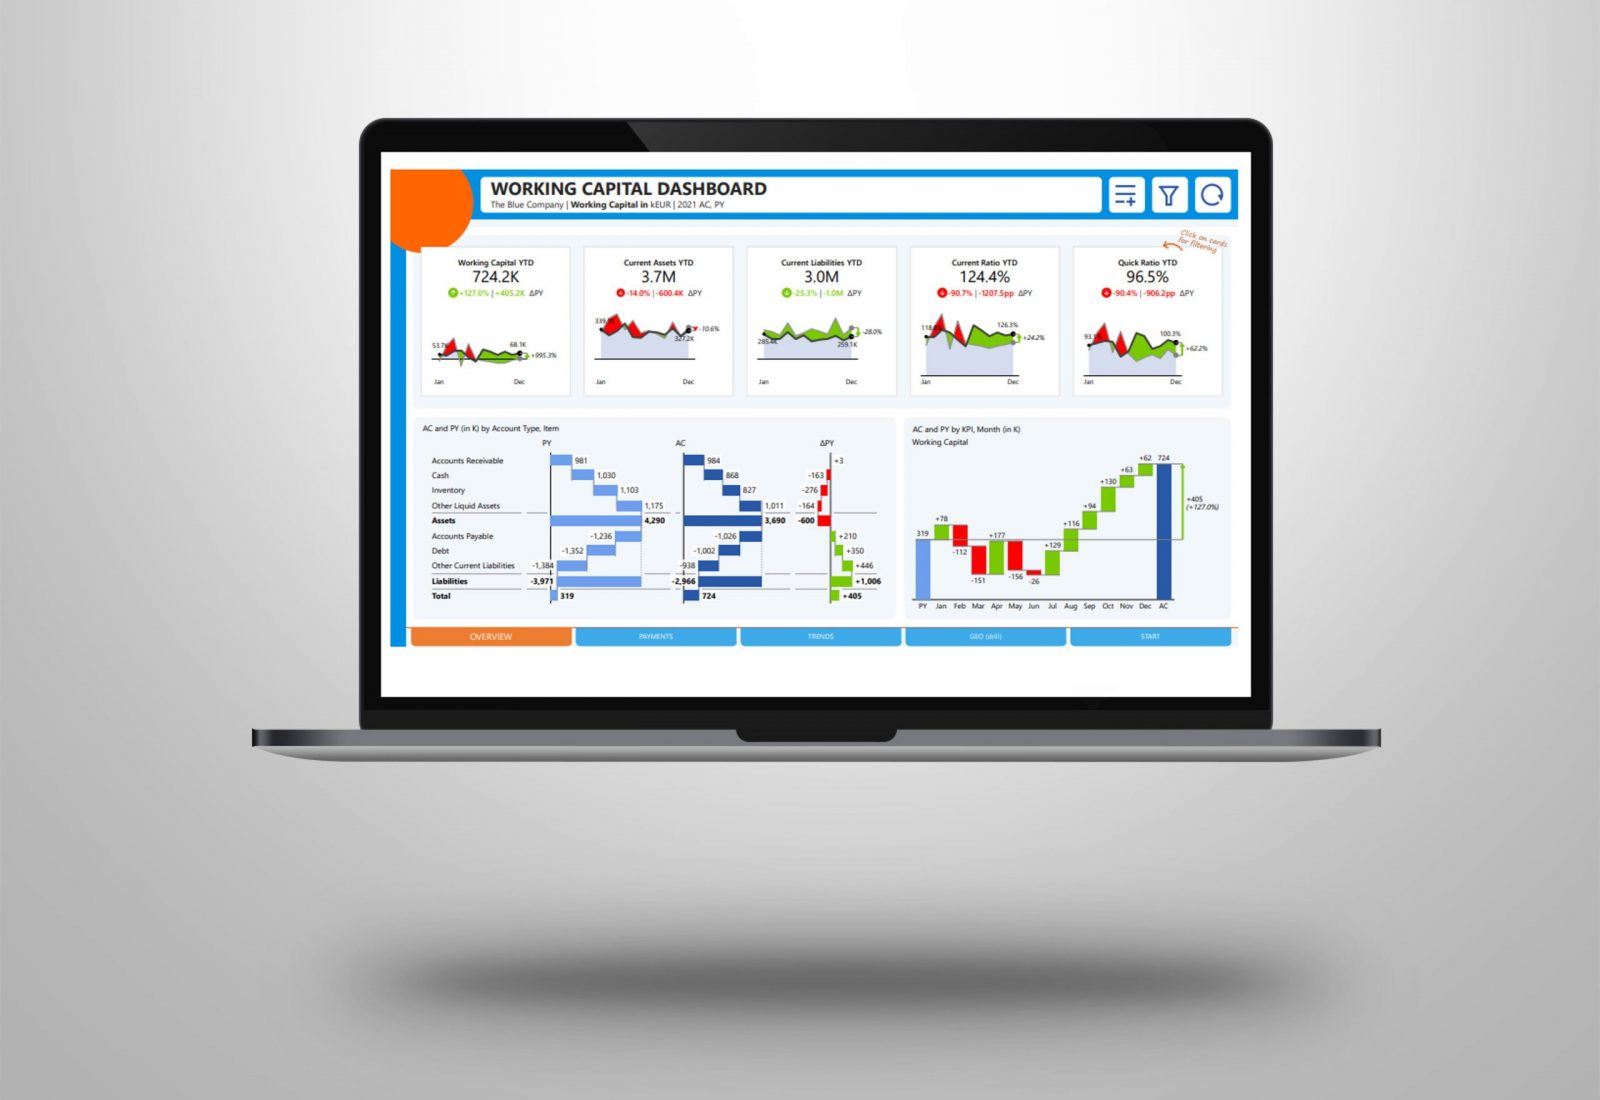
Power BI | Working capital dashboard with a Coolblue design
Did you ever think of using IBCS standards to your Power BI dashboard? But …….. you think the IBCS colors (grey) are boring ……? Why not use your corporate identity and replace the >> Lees verder
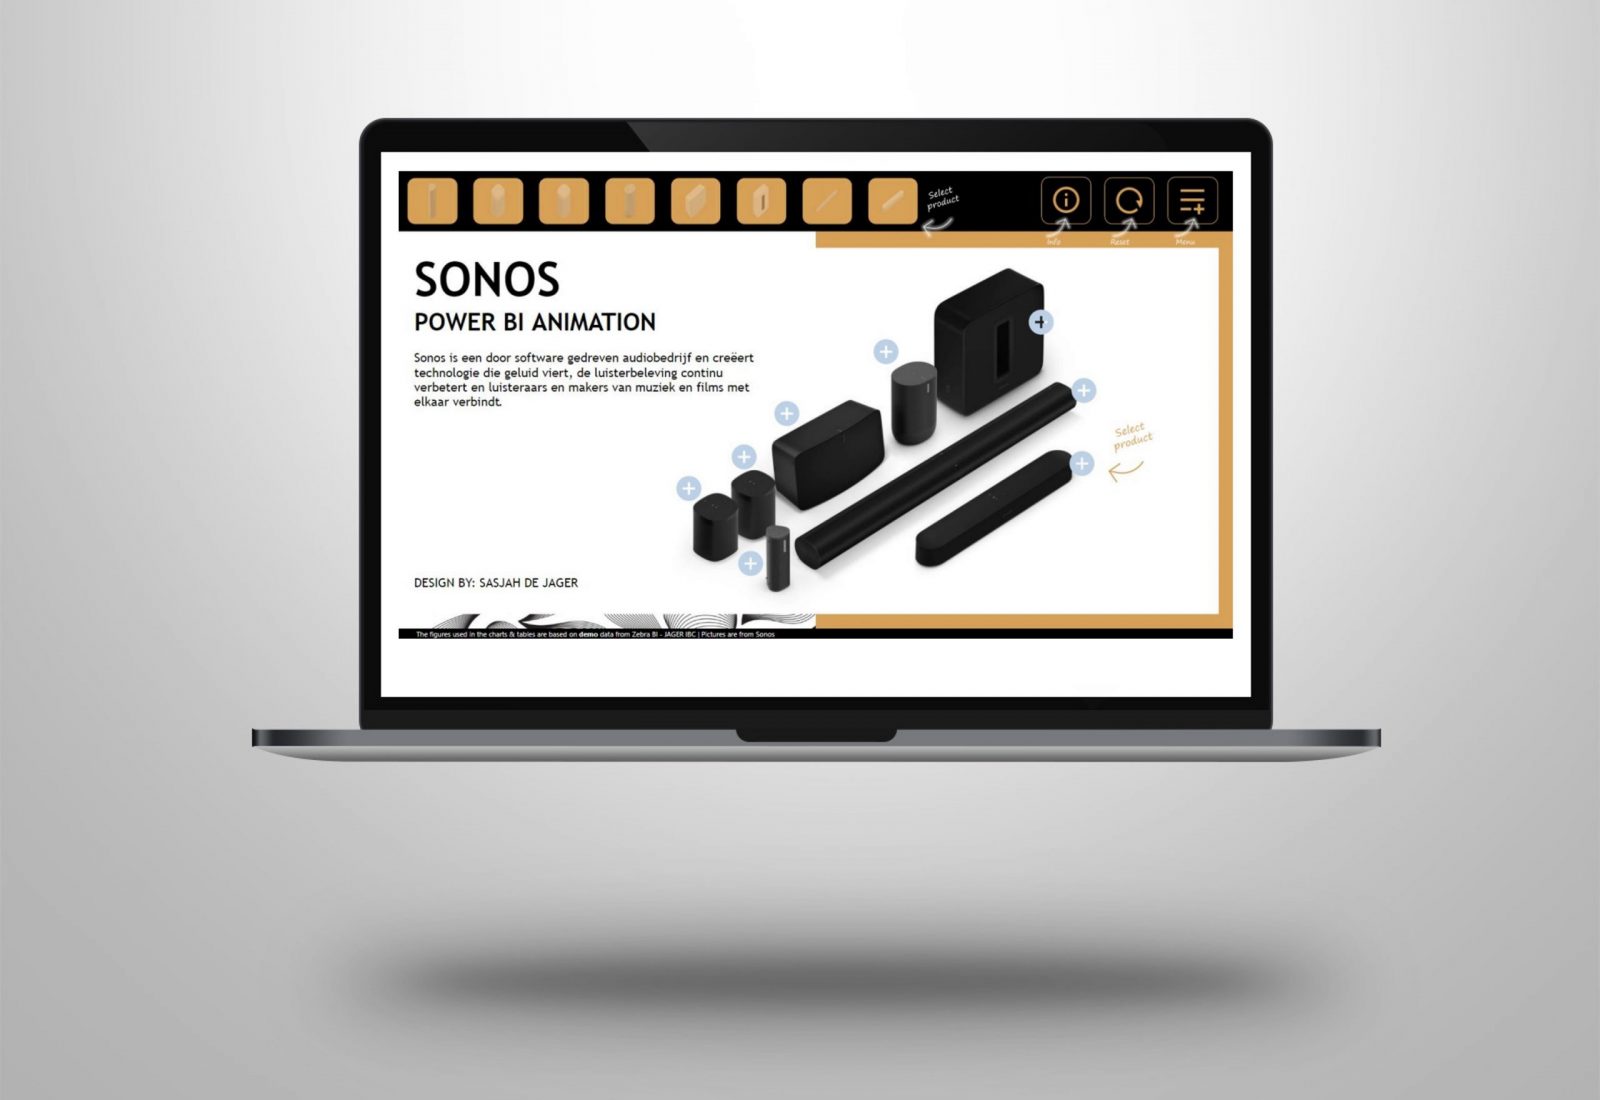
Power BI | Sonos product animation
How do you play your music, at home, at work or on the go? Since the early beginning I’m a big fan of the Sonos products for listening to music. Music gives a >> Lees verder
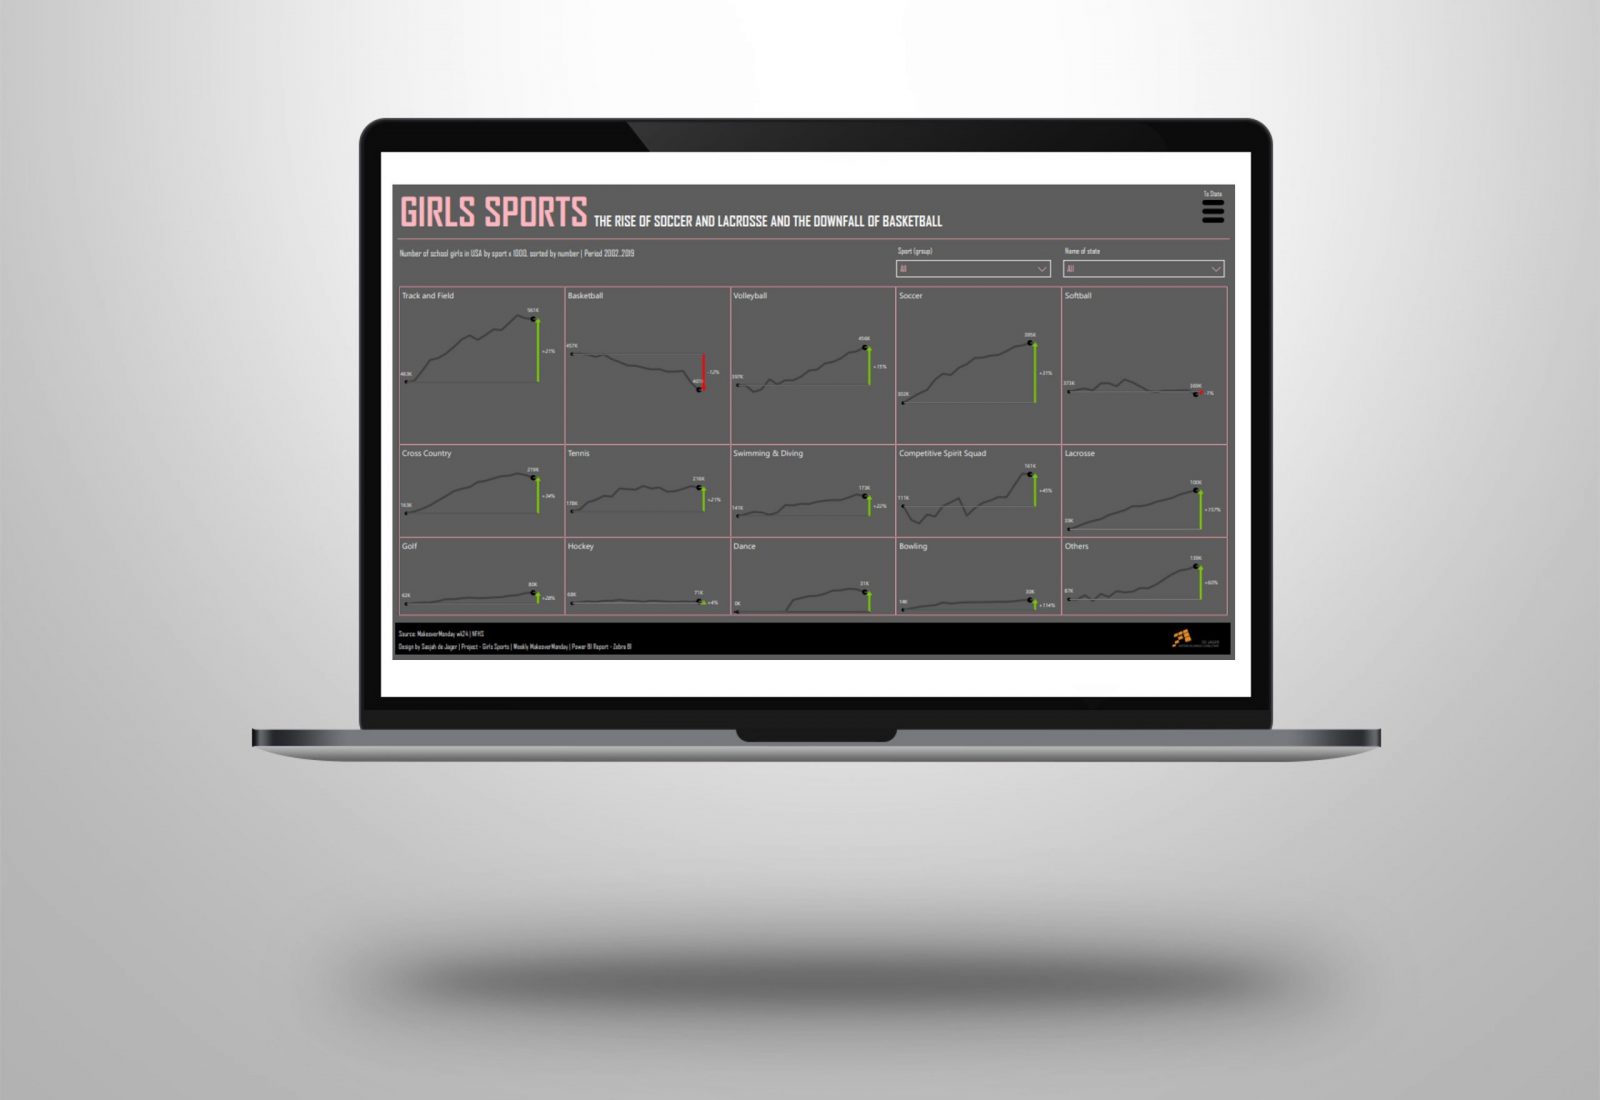
Power BI | Visualizing Girls Sports – makeover monday
Visualizing Girls Sports The rise of soccer and lacrosse and the downfall of basketball. This week’s visualization is about the development of girls sports in the US which is part of MakeoverMonday week >> Lees verder
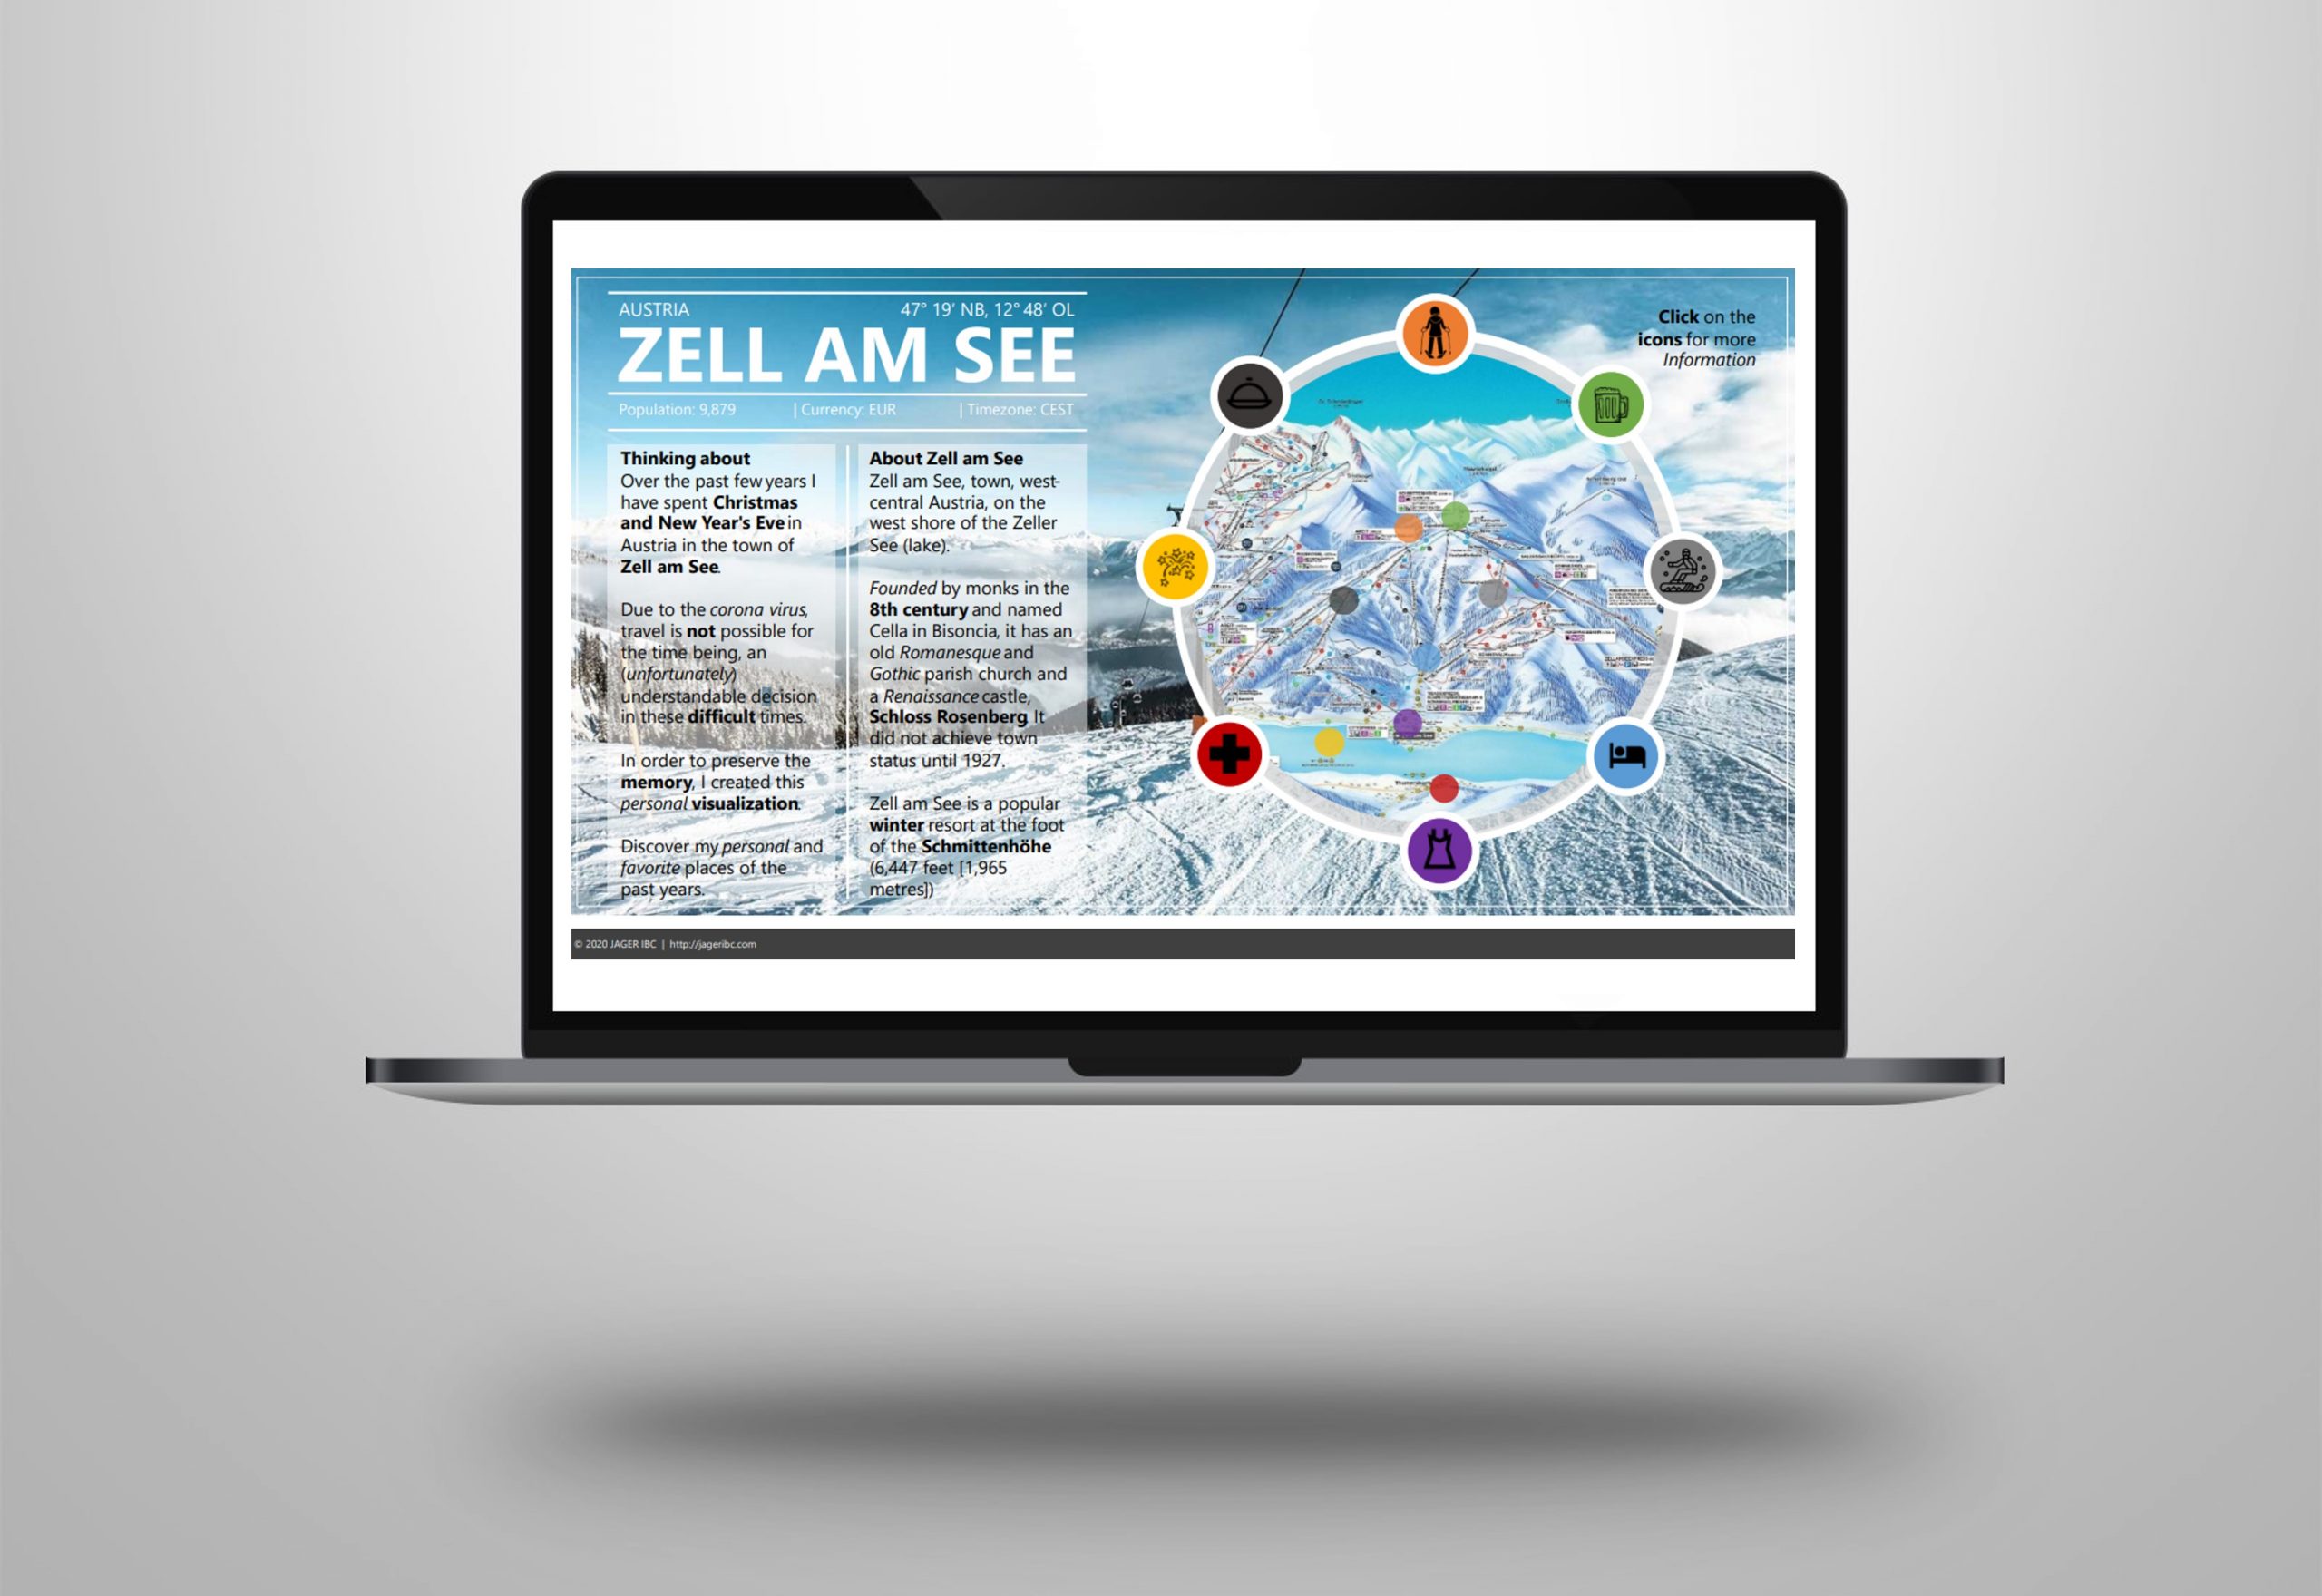
Power BI | Zell am See – discover my personal and favorite places
Thinking about Over the past few years I have spent Christmas and New Year's Eve in Austria in the town of Zell am See. Due to the corona virus, travel is not possible >> Lees verder
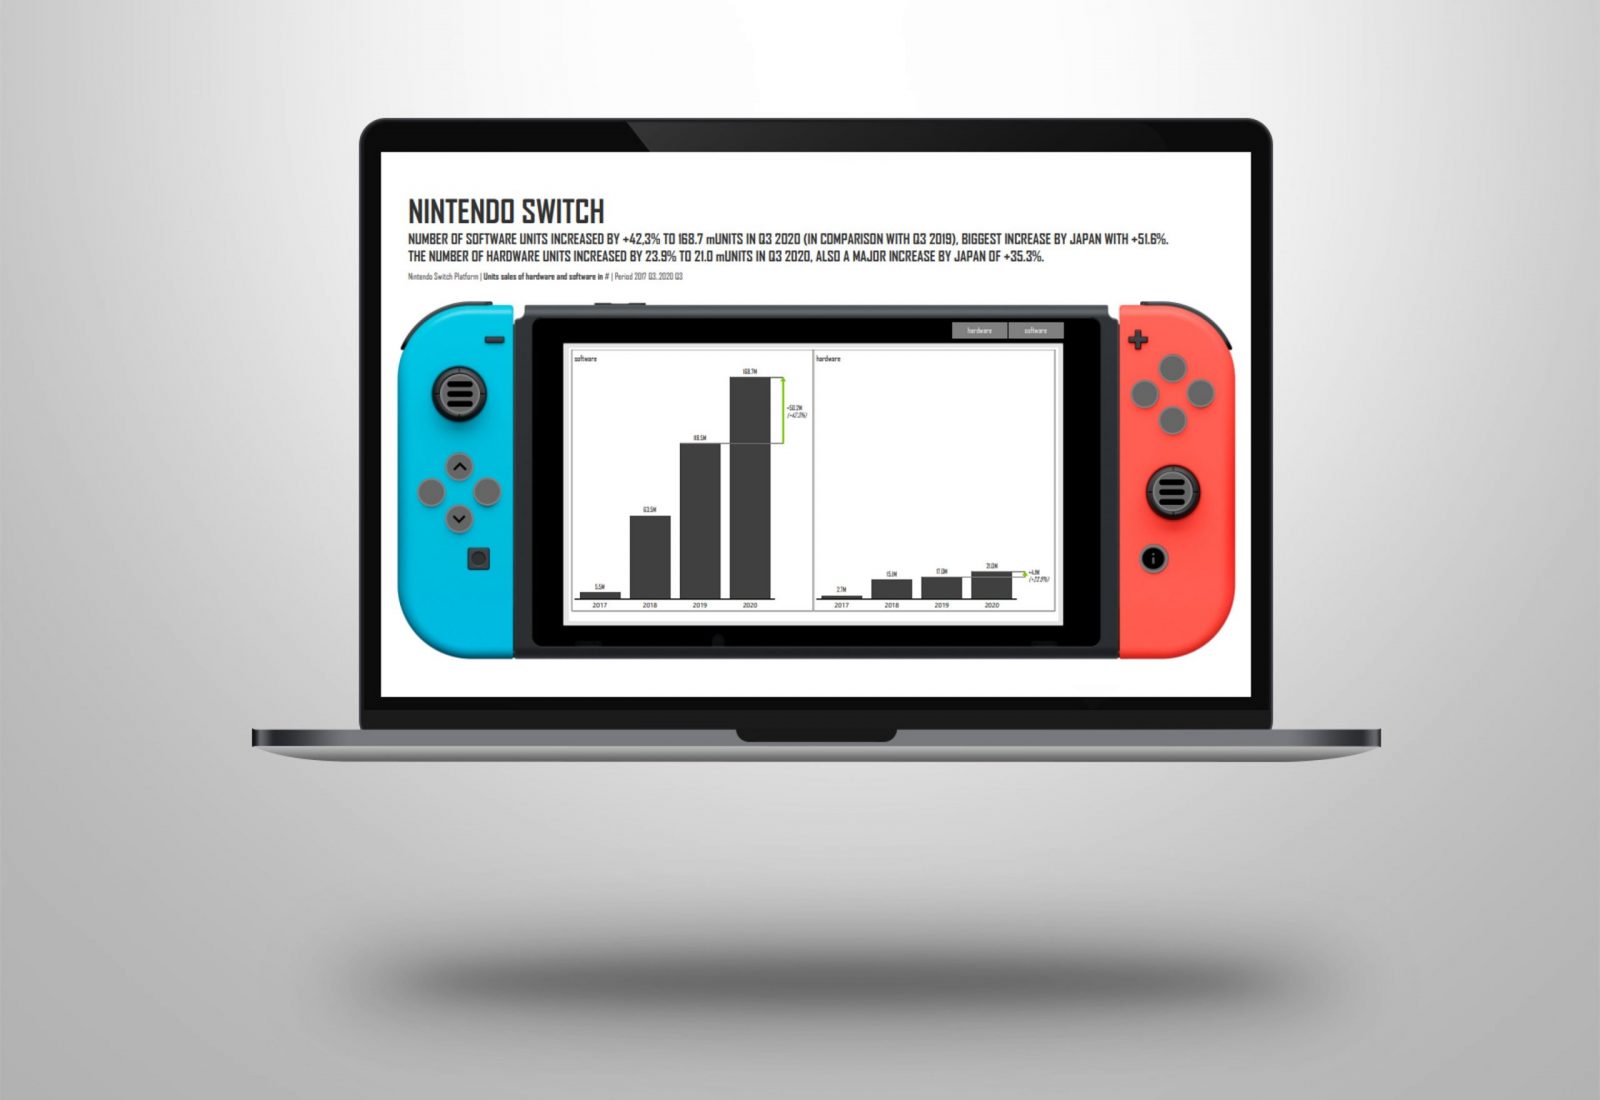
Power BI | “Visualizing – with – Nintendo”
This week’s visualization is about the number of sold Nintendo units (hardware and software) as part of MakeoverMonday week 45. The original viz is from Nintendo itself. Take a look at the original >> Lees verder
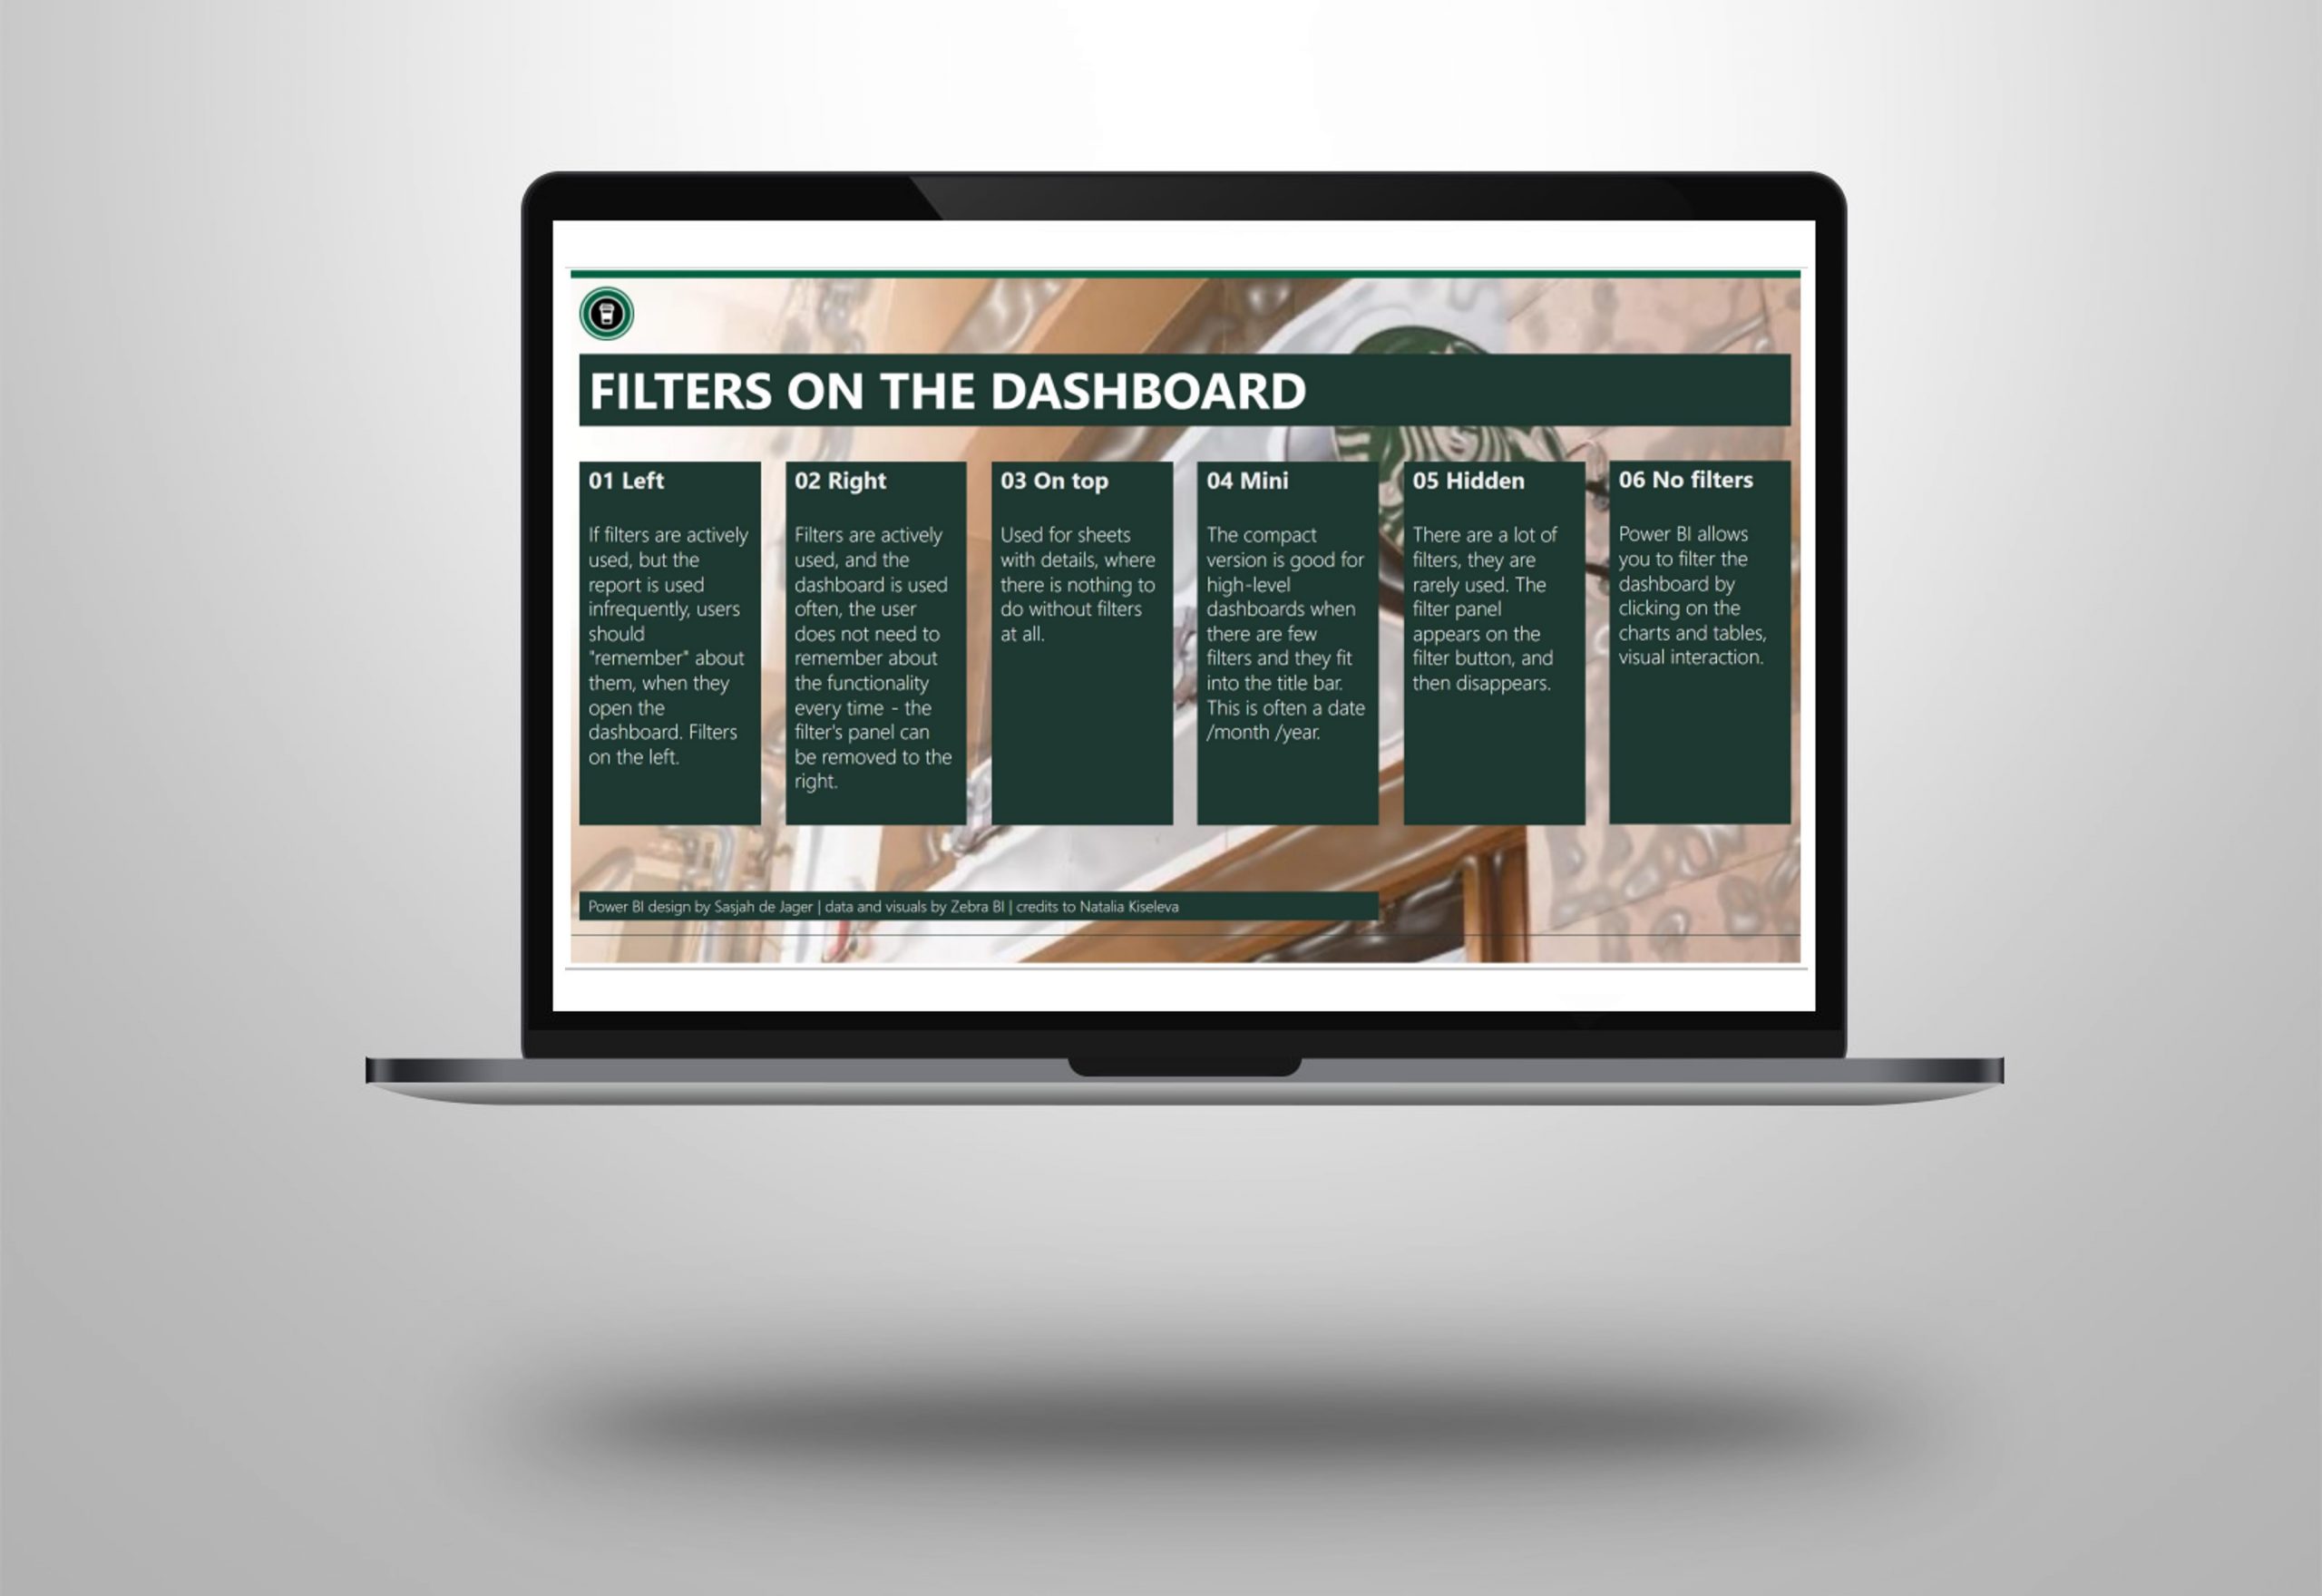
Power BI | filters on the dashboard with starbucks
our expertise When designing a Power BI dashboard / report the use and placing of the filters can be a bit of a dilemma. Place the filters to the left, right, hide the >> Lees verder

Power BI | Board Deck presentation with a KPN taste
Many companies are still using PowerPoint for presenting their quarterly figures. For the people behind this presentation, it cost a lot of manual work to create it, a lot of copy and pasting. >> Lees verder
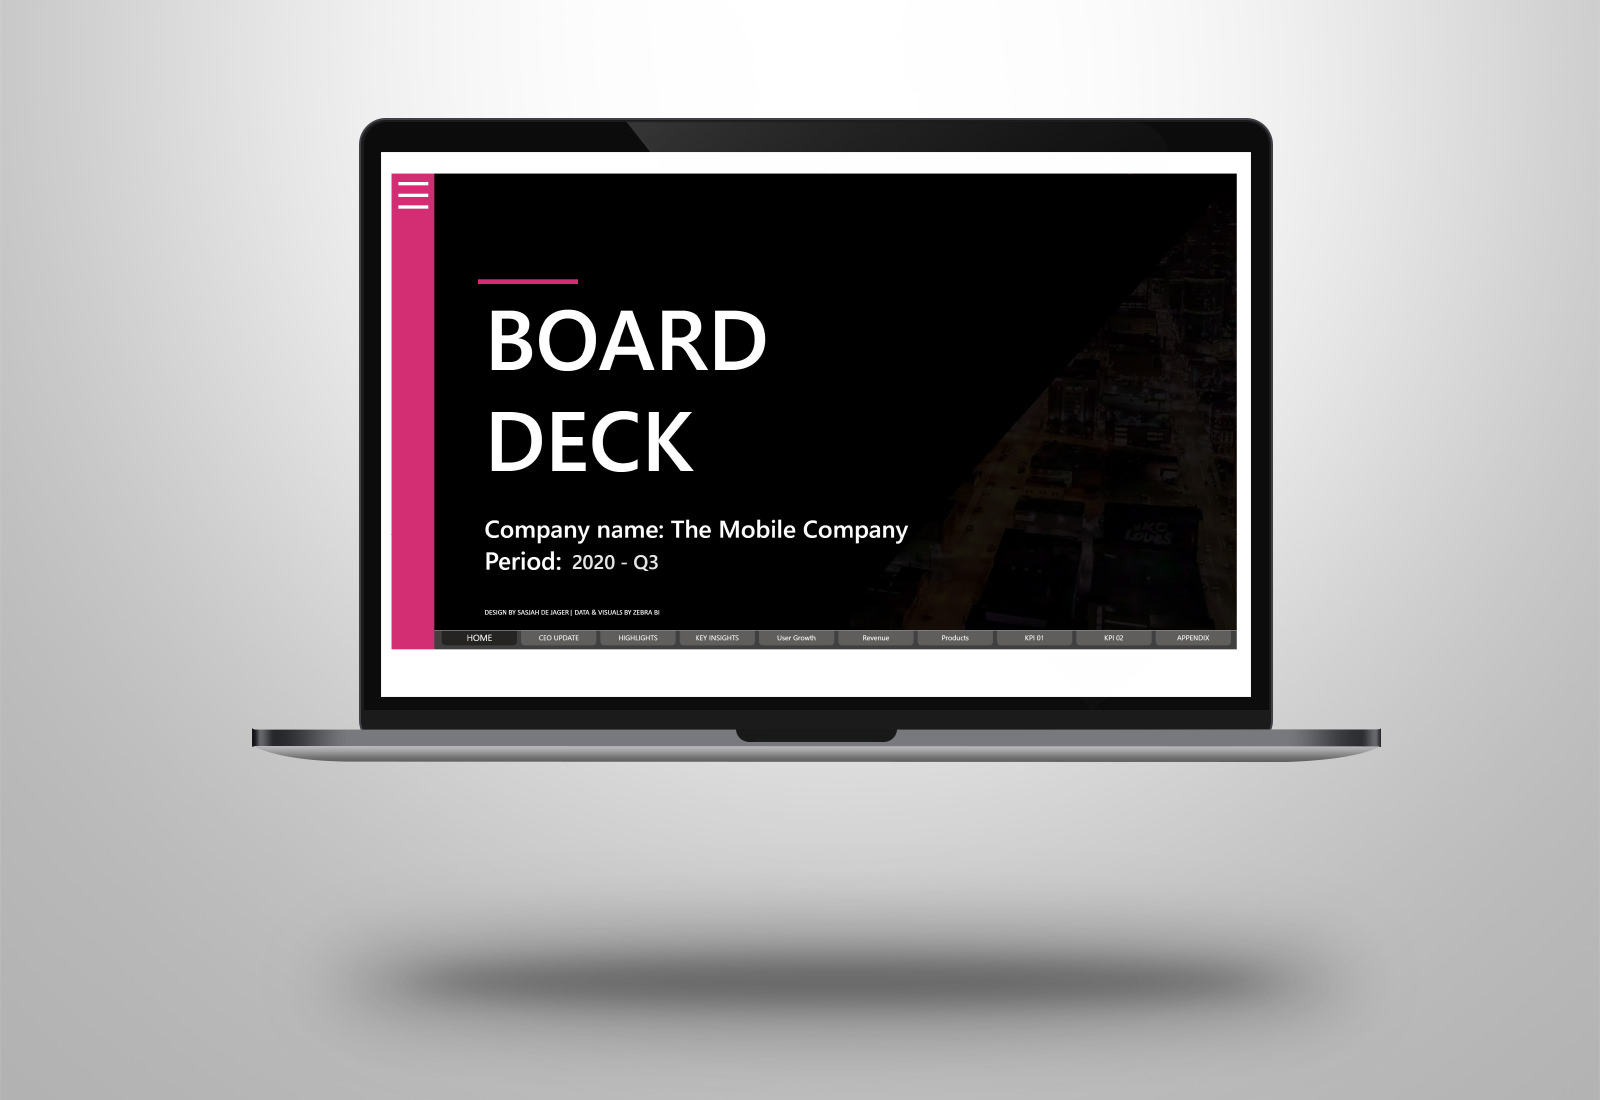
Power BI | Board Deck presentation with a T-Mobile design
Many companies are still using PowerPoint for presenting their (quarterly) figures. For the people behind this presentation, it cost a lot of manual work to create it, a lot of copy and pasting. >> Lees verder
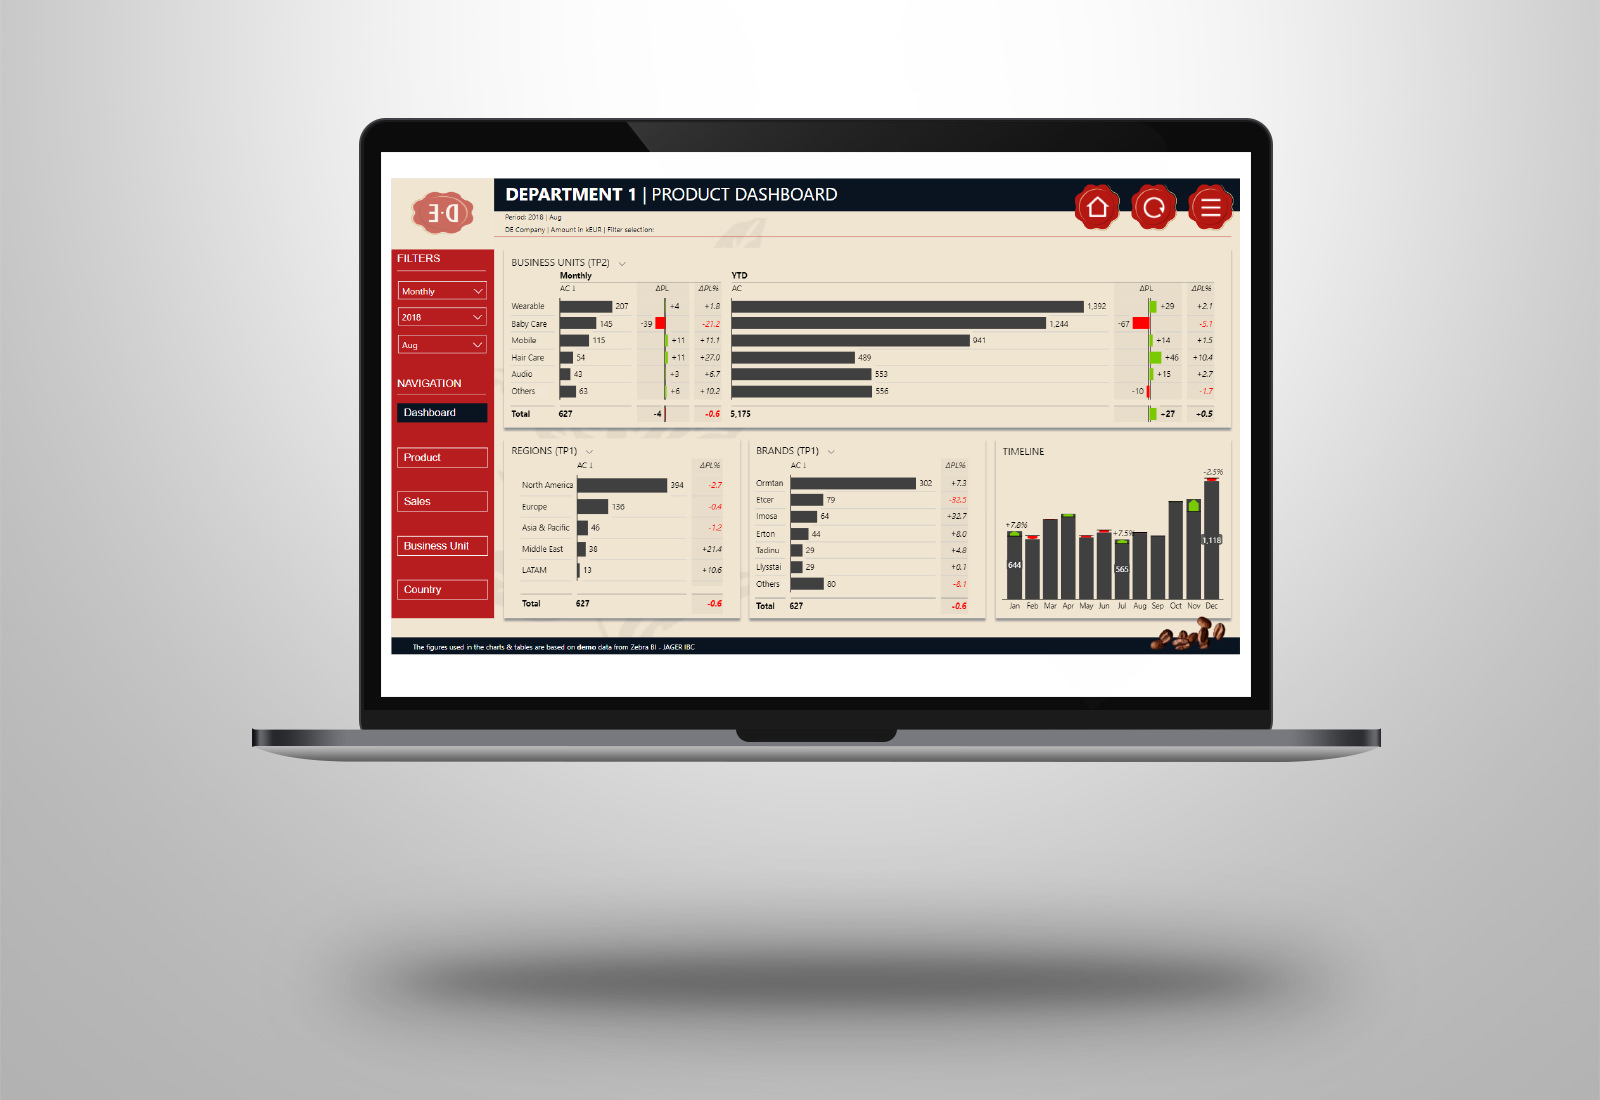
Power BI | dashboard with a Douwe Egberts taste
Many people are working at home during the corona period. One of the advantages of this is that we can choose our own favorite coffee. I like to drink coffee of Douwe Egberts. >> Lees verder

Power BI | dashboard with a Milka taste
our expertise Characteristic of Milka is not only the delicious taste of their chocolate but of course also the purple cow, who doesn’t know it.I thought it would be fun to make a Milka >> Lees verder